Definition
The Ichimoku cloud is five lines built from the highs, lows and closes of recent candles. Three are midpoints of a price range (the Tenkan-sen, the Kijun-sen and Senkou span B), one is the average of two of those (Senkou span A), and one is the close drawn back in time (the Chikou span). The shaded space between the two Senkou lines, drawn ahead of price, is the cloud, or kumo.
It measures where price sits against the midpoints of a short, a medium and a long range, and whether those ranges are still moving. Use it to decide whether a setup's trigger sits with the cloud, inside it or against it, and whether the market is trending or sitting in a range, before you look at the trigger itself.
How it works
The five lines
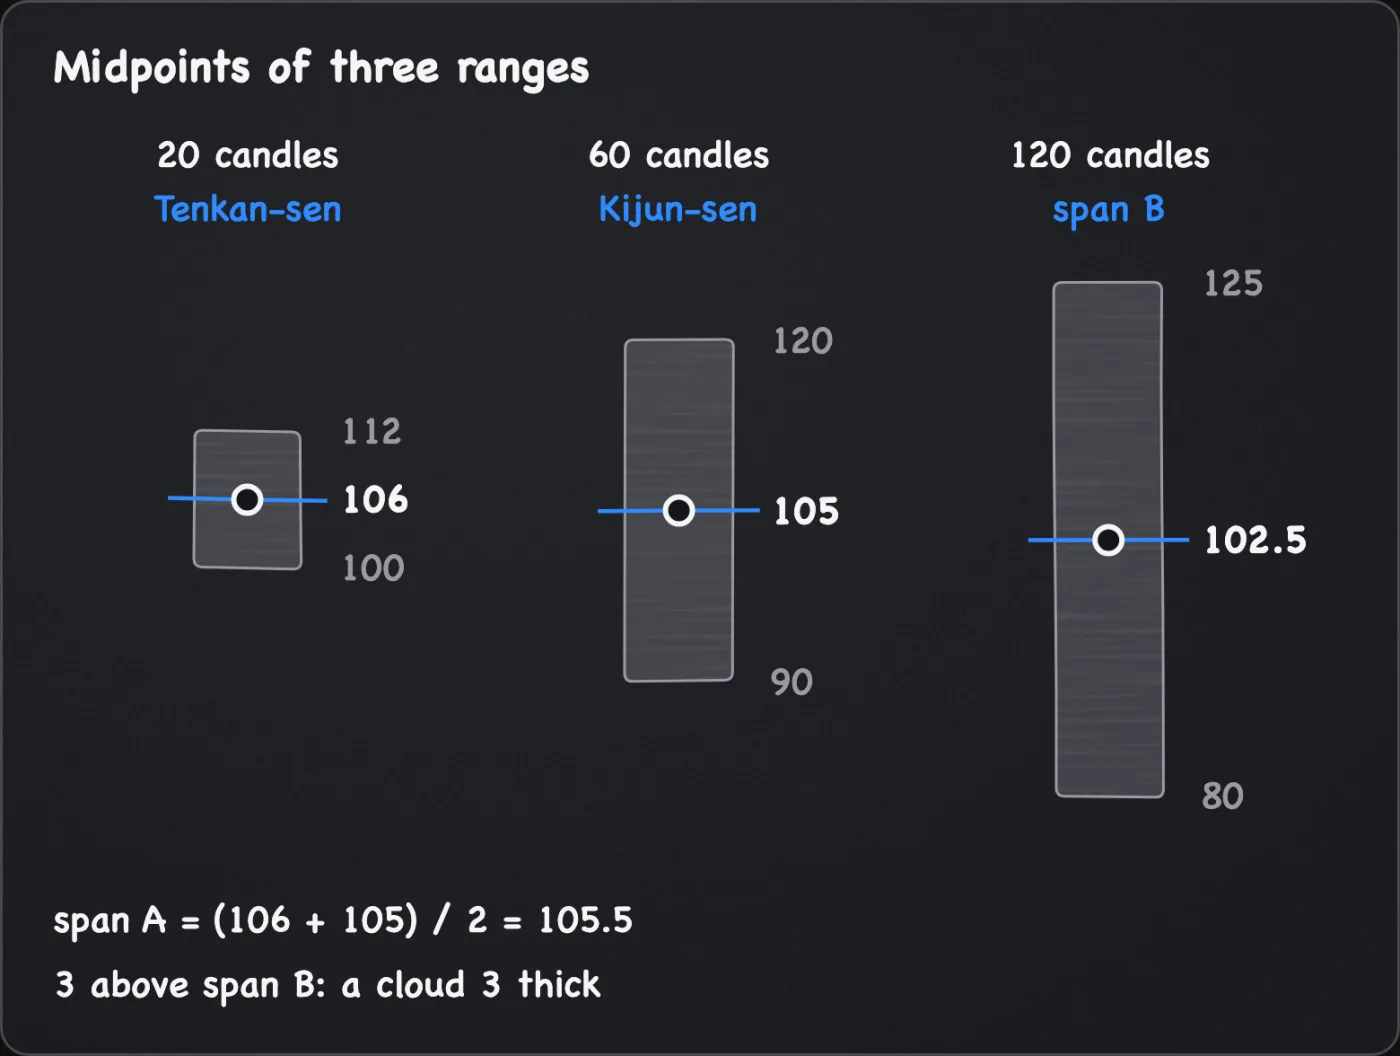
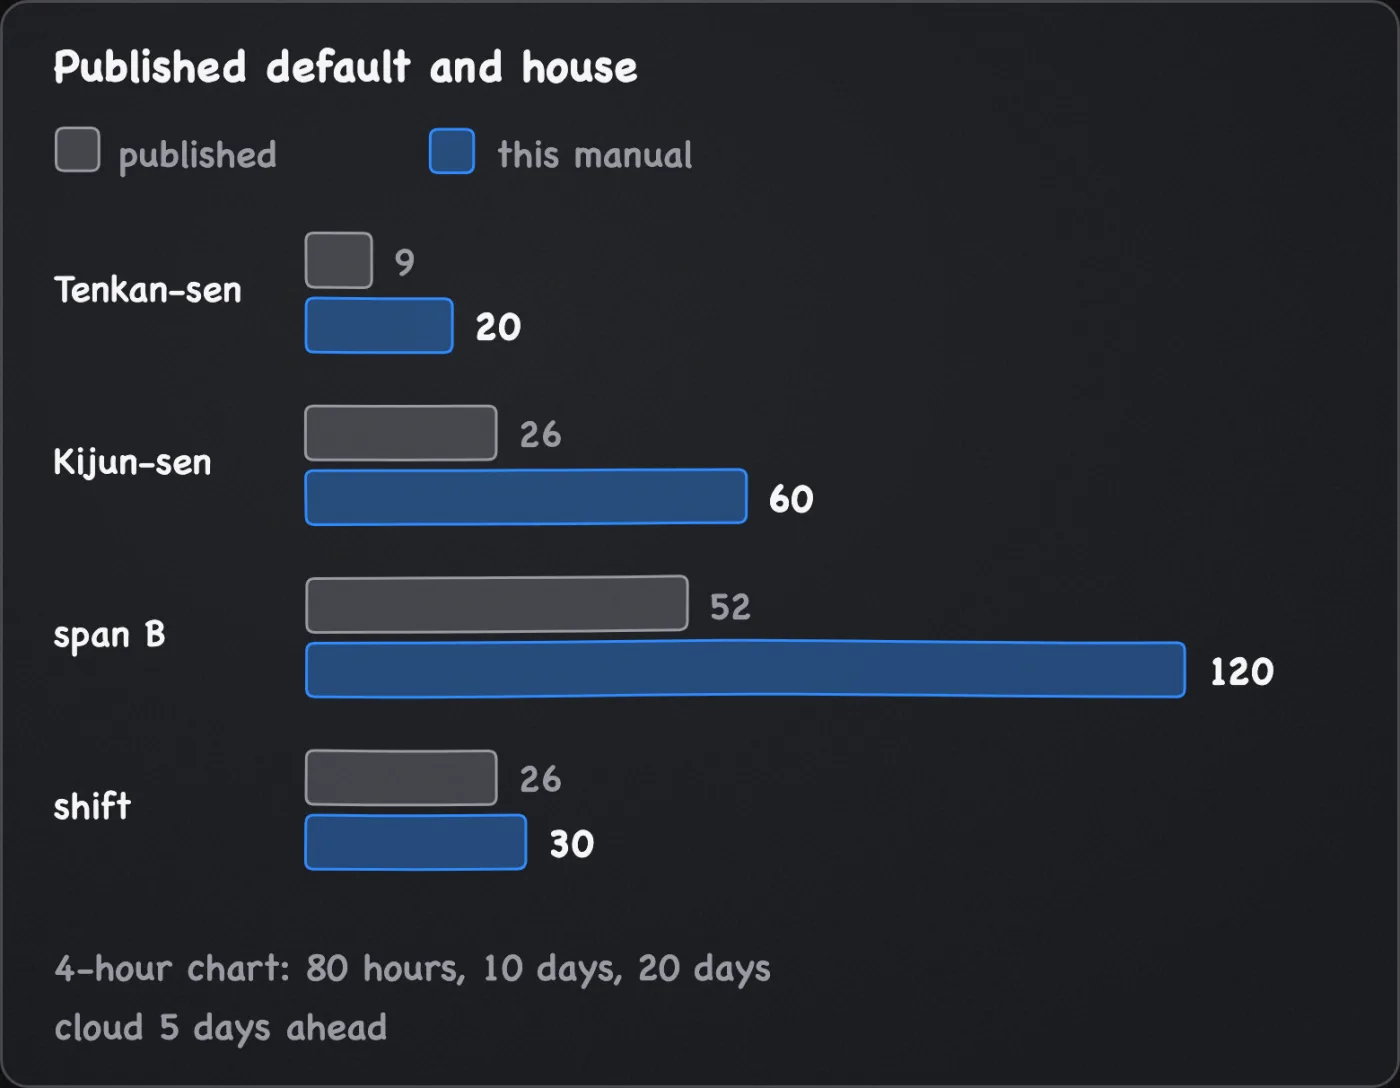
Each midpoint line adds its lookback's highest high to its lowest low and halves the result. With this manual's settings, explained in the table below, the lookbacks are 20, 60 and 120 candles, and the shift is 30 candles.
- Tenkan-sen (conversion line): the midpoint of the last 20 candles.
- Kijun-sen (base line): the midpoint of the last 60 candles.
- Senkou span B (leading span B): the midpoint of the last 120 candles, drawn 30 candles ahead.
- Senkou span A (leading span A): the Tenkan-sen plus the Kijun-sen, divided by two, drawn 30 candles ahead.
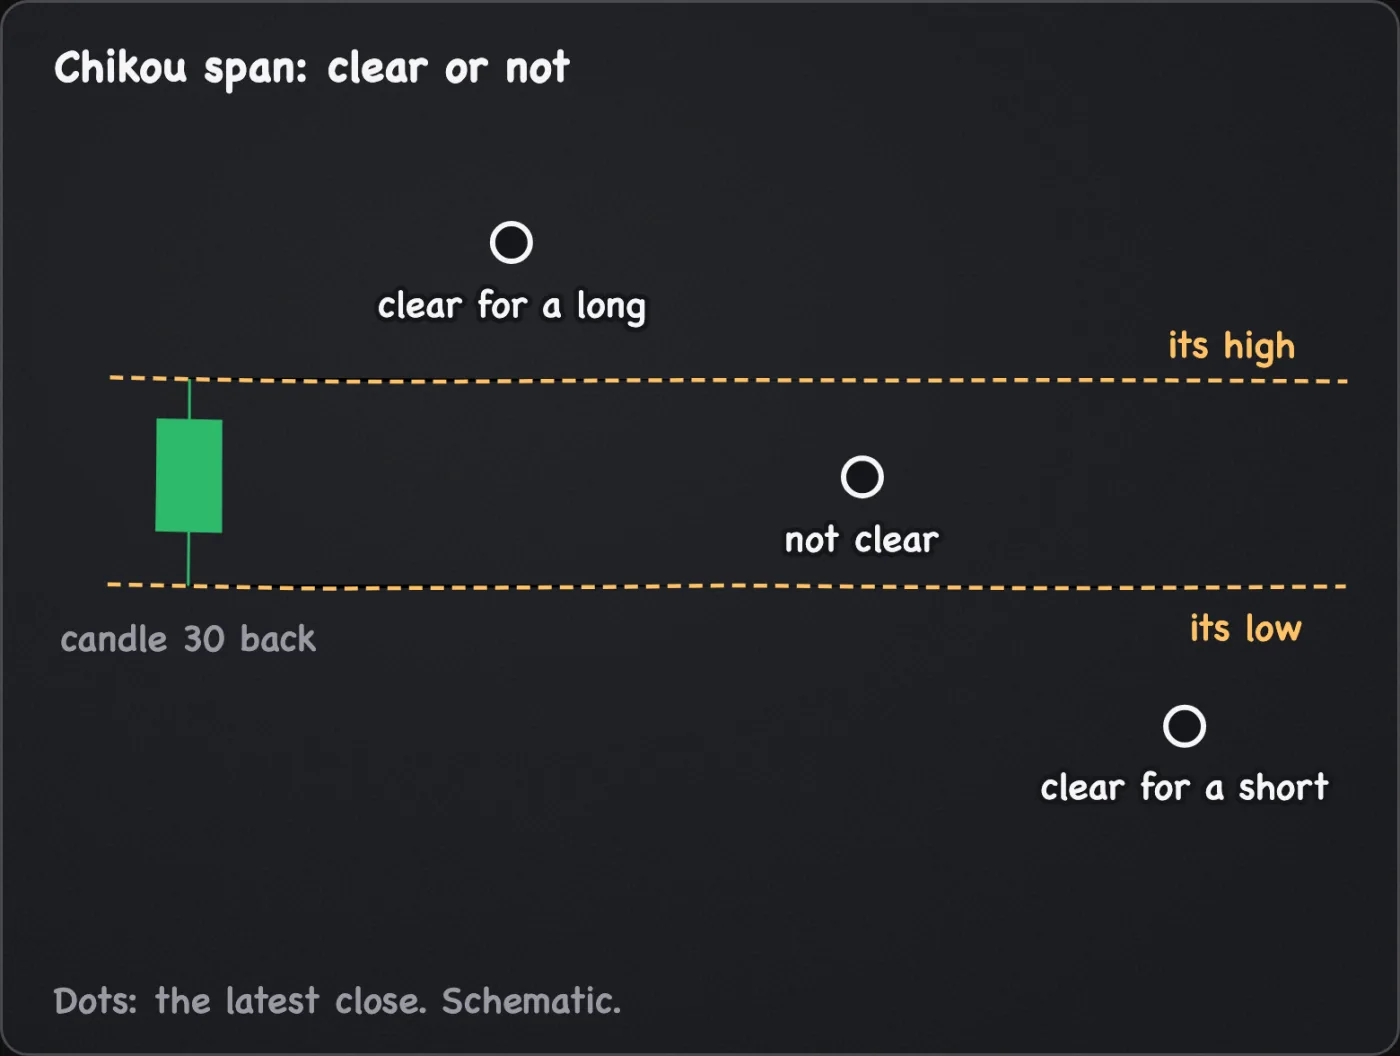
- Chikou span (lagging span): the latest close, drawn 30 candles back.
- The cloud: the area between spans A and B. Many platforms colour it green by default when A is above B and red when A is below B. The colour is a setting; the test is which span is higher.
For arithmetic only, assume that at the latest candle the 20-candle high and low are 112 and 100, the 60-candle pair is 120 and 90, and the 120-candle pair is 125 and 80. Then the Tenkan-sen is 106, the Kijun-sen is 105 and span B is 102.5. Span A is (106 + 105) / 2 = 105.5. A sits 3 above B, so the cloud at its right-hand end is green and 3 thick.
On a 4-hour chart those windows are 80 hours, 10 days and 20 days, and the cloud reaches 5 days past the last candle.
Midpoints are not moving averages
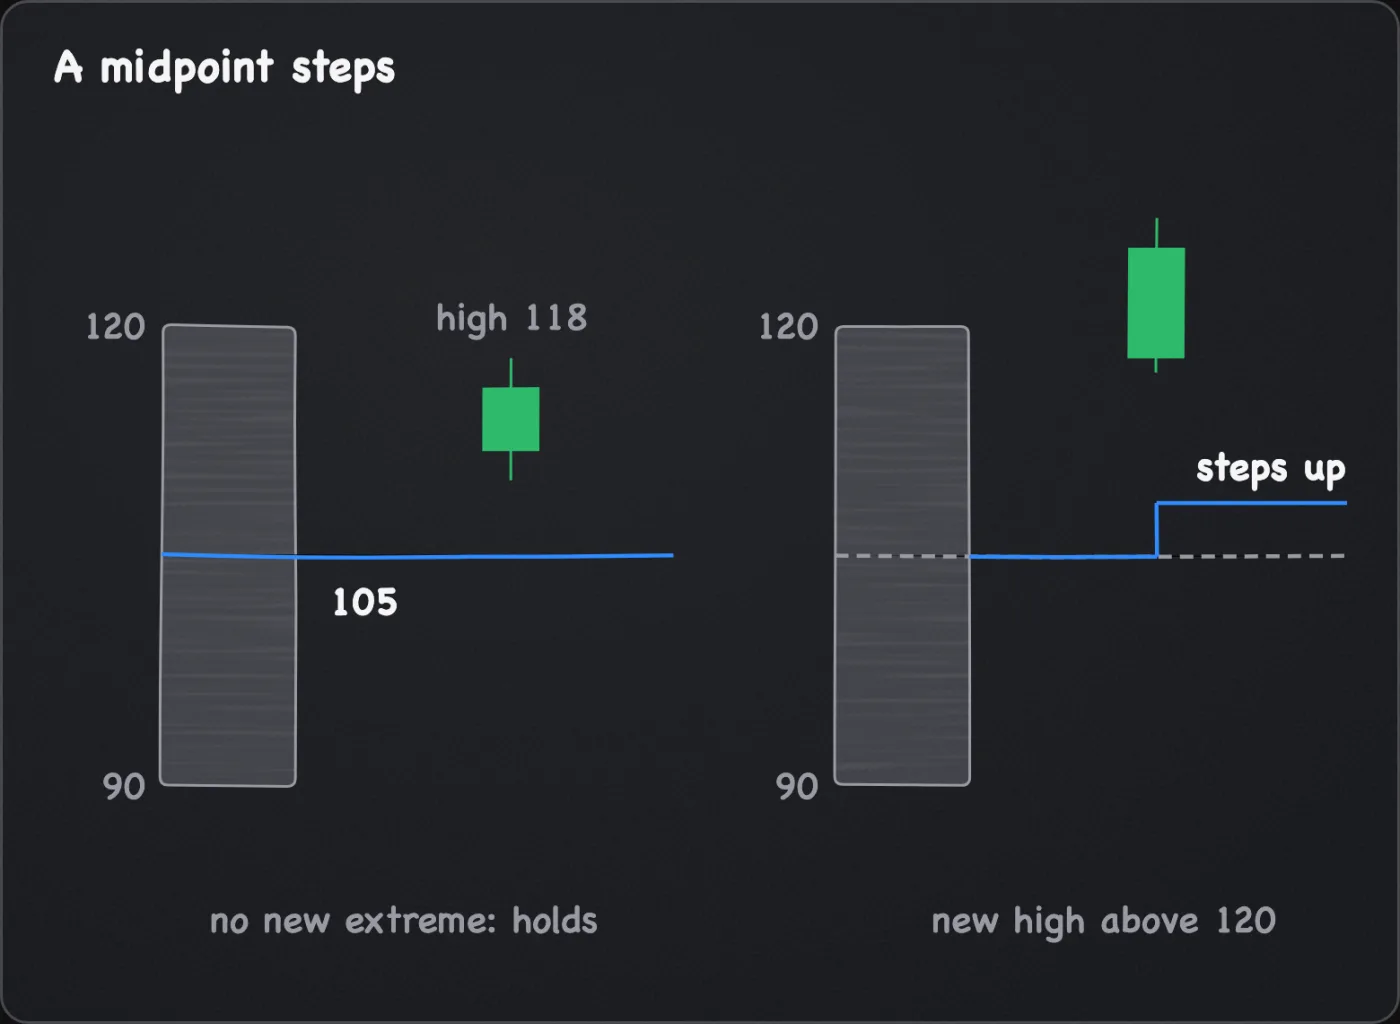
A moving average is recalculated with every close and responds to each one. A midpoint depends only on its window's highest high and lowest low, so closes between them do not matter. Keep the assumed 60-candle window with a high of 120 and a low of 90. A new candle with a high of 118 and a low above 90 changes neither extreme, so the Kijun-sen stays at 105, provided the candle leaving the window held neither extreme, even if price has climbed. The line moves when a new extreme prints, or when the candle holding an extreme drops out of the window and the next highest or lowest value takes its place. Then it steps rather than glides. The moving averages page covers the averages this differs from.
That is why the lines go flat. While the window's high and low stay where they are, the midpoint holds. A 120-candle window changes its extremes less often than a 20-candle one, so span B is flat for longer. This is arithmetic, not a belief. Flat does not mean the line sits at a level price reacts to. It is the middle of a range, not an extreme.
The cloud under price, and the cloud ahead
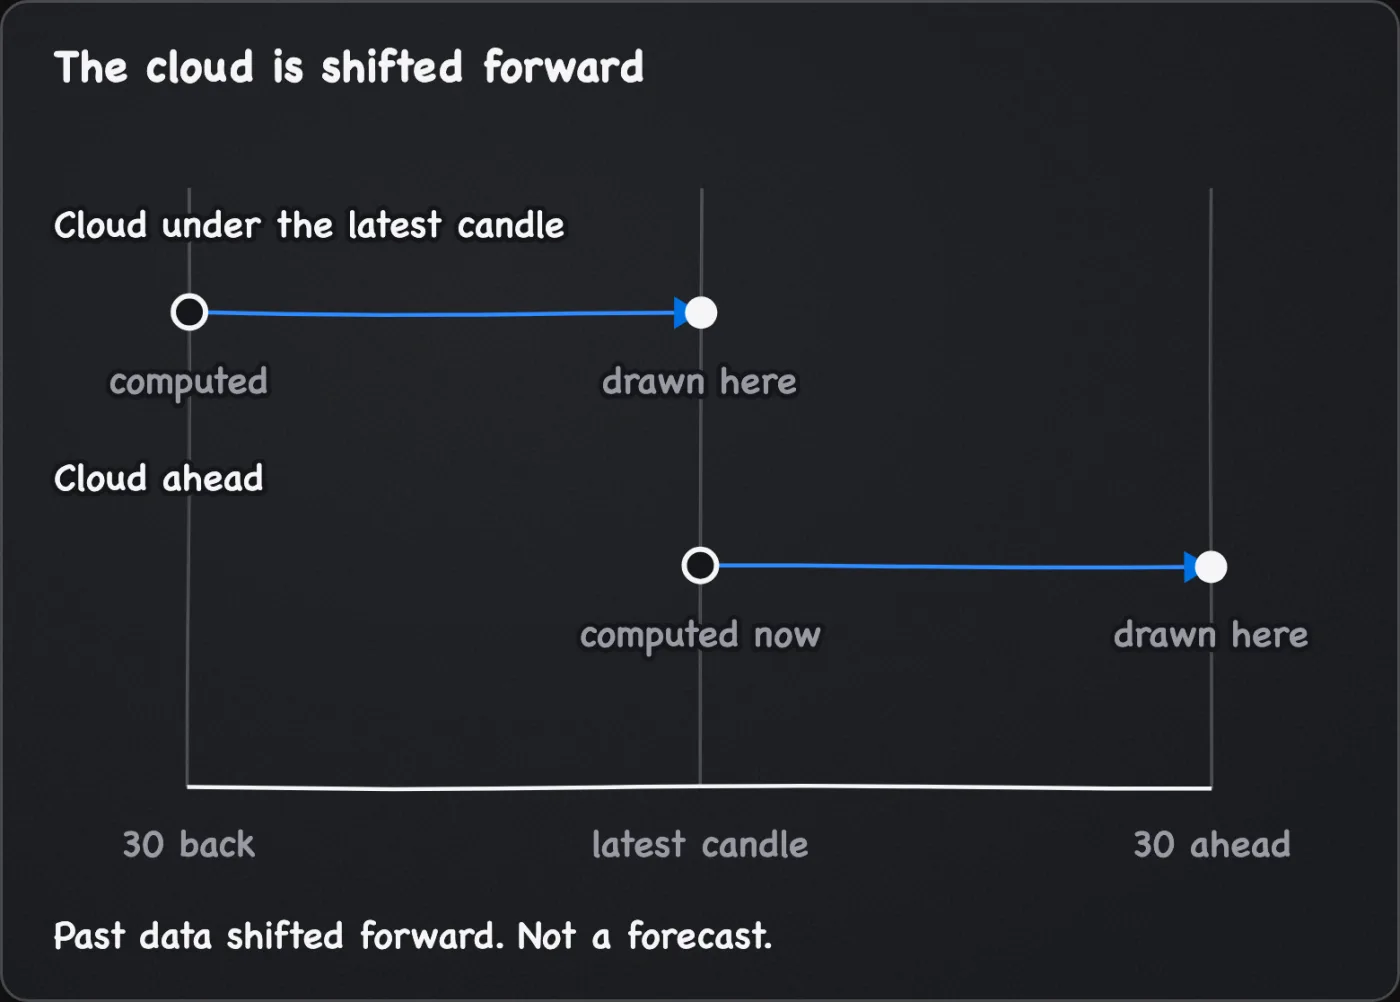
The cloud under a candle was computed 30 candles earlier. The cloud ahead, to the right of the latest candle, is today's span A and span B shifted forward. It is not a forecast. Every value in it comes from candles that have already printed.
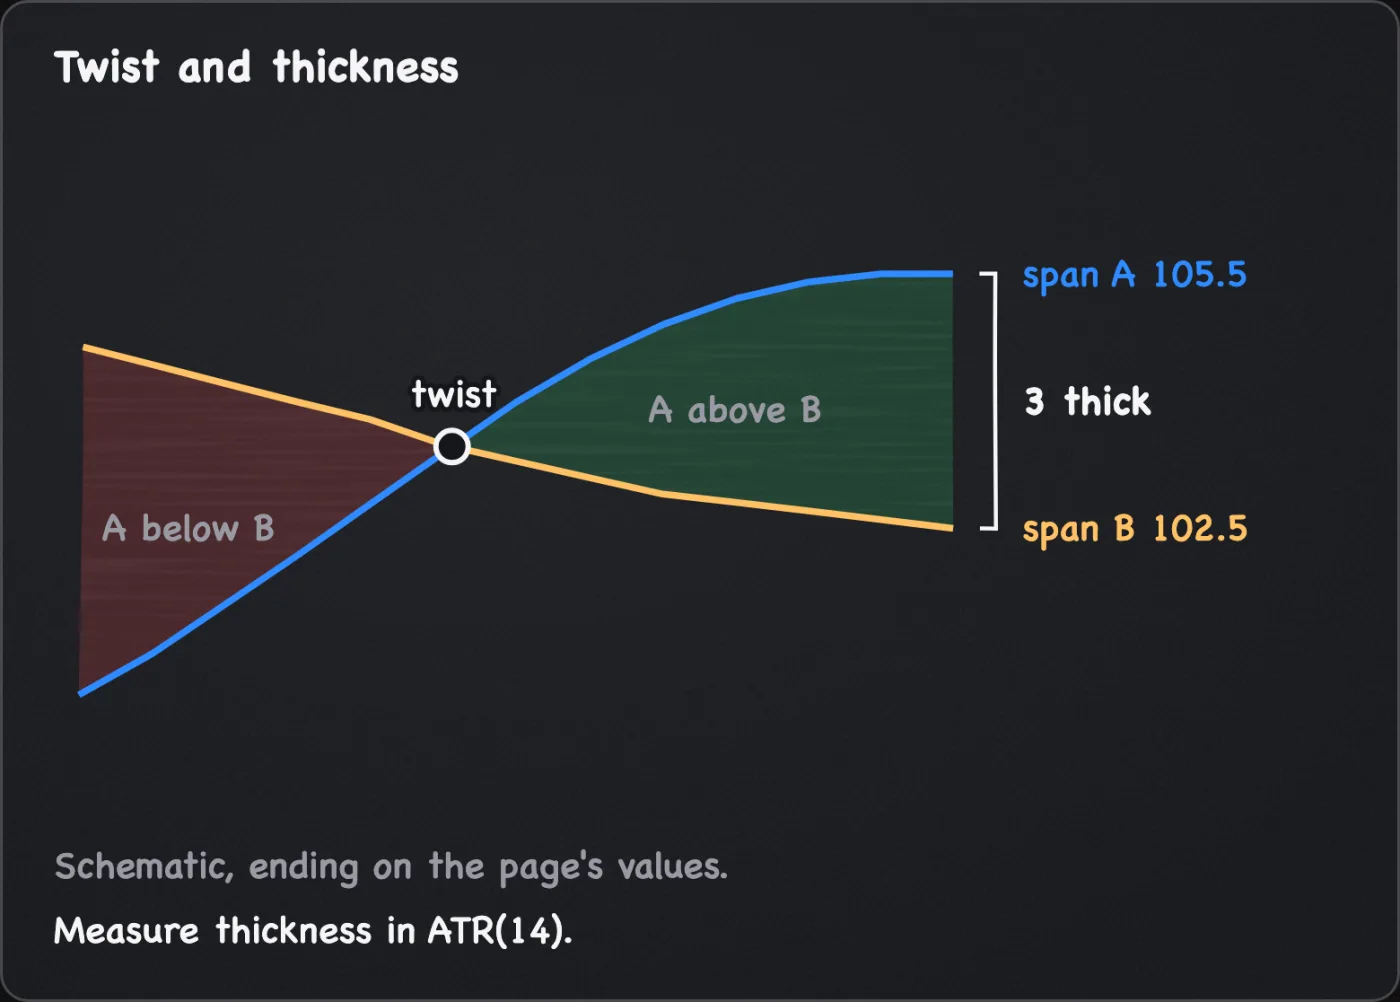
A kumo twist is where span A crosses span B, so the cloud changes colour. It means the average of the short and medium midpoints has crossed the long midpoint. A twist inside the part of the cloud ahead is already determined by data up to now. A twist under price is old news.
Thickness is the gap between A and B. Compare it in ATR(14) terms, not raw price, because a gap of 3 means different things on different coins. A common belief is that a thick cloud is a stronger zone than a thin one. This page cites no test of that.
The Chikou span
The Chikou span compares the latest close with the candle 30 back. This manual reads it as clear of price when the latest close is above the high of that candle for a long, or below its low for a short. A close inside that candle's range is not clear. It is a trend comparison across 30 candles, not independent information. Platforms count the shift differently. TradingView counts the latest candle as the first, so with an input of 30 the line sits over the candle 29 bars back. Use the candle the Chikou span is drawn over, and check it the same way every time.
Location as a condition
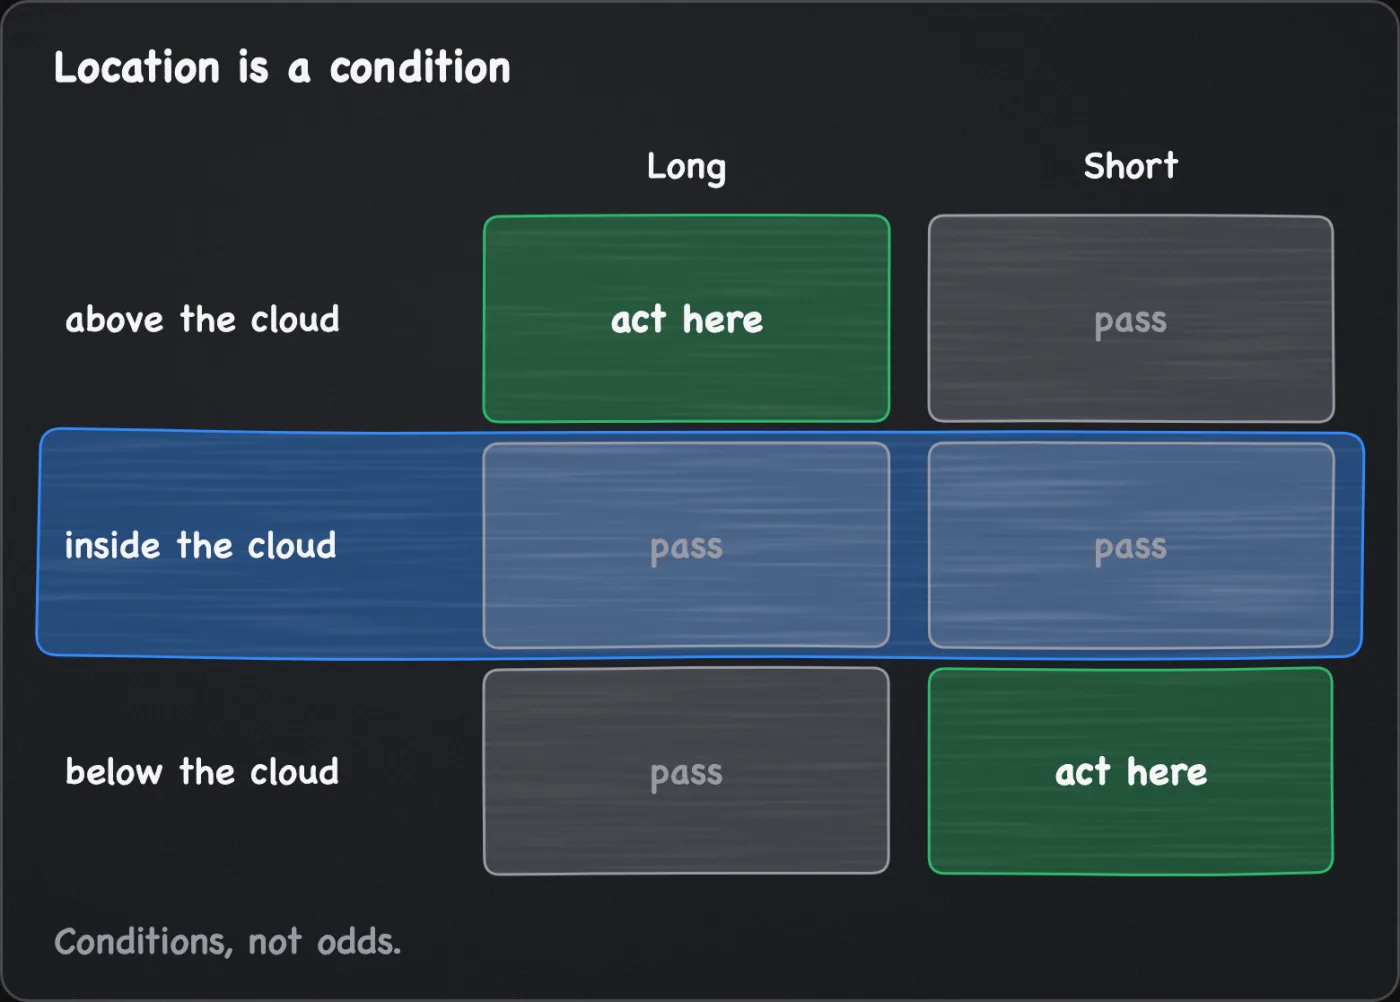
Traders often grade a signal by where it sits against the cloud. This manual states the same thing as a condition. A signal is a Tenkan-sen and Kijun-sen cross, a close through the Kijun-sen or a close out of the cloud, and its location is where price and the cross sit against the cloud under the candle.
| Location of price and the cross | Long setups | Short setups |
|---|---|---|
| Above the cloud | With the cloud: this manual's long setups act here | Against the cloud: pass |
| Inside the cloud | Undecided: pass | Undecided: pass |
| Below the cloud | Against the cloud: pass | With the cloud: this manual's short setups act here |
These are conditions the setups require, not odds. This page cites no test that a signal with the cloud does better than one inside or against it.
The range test
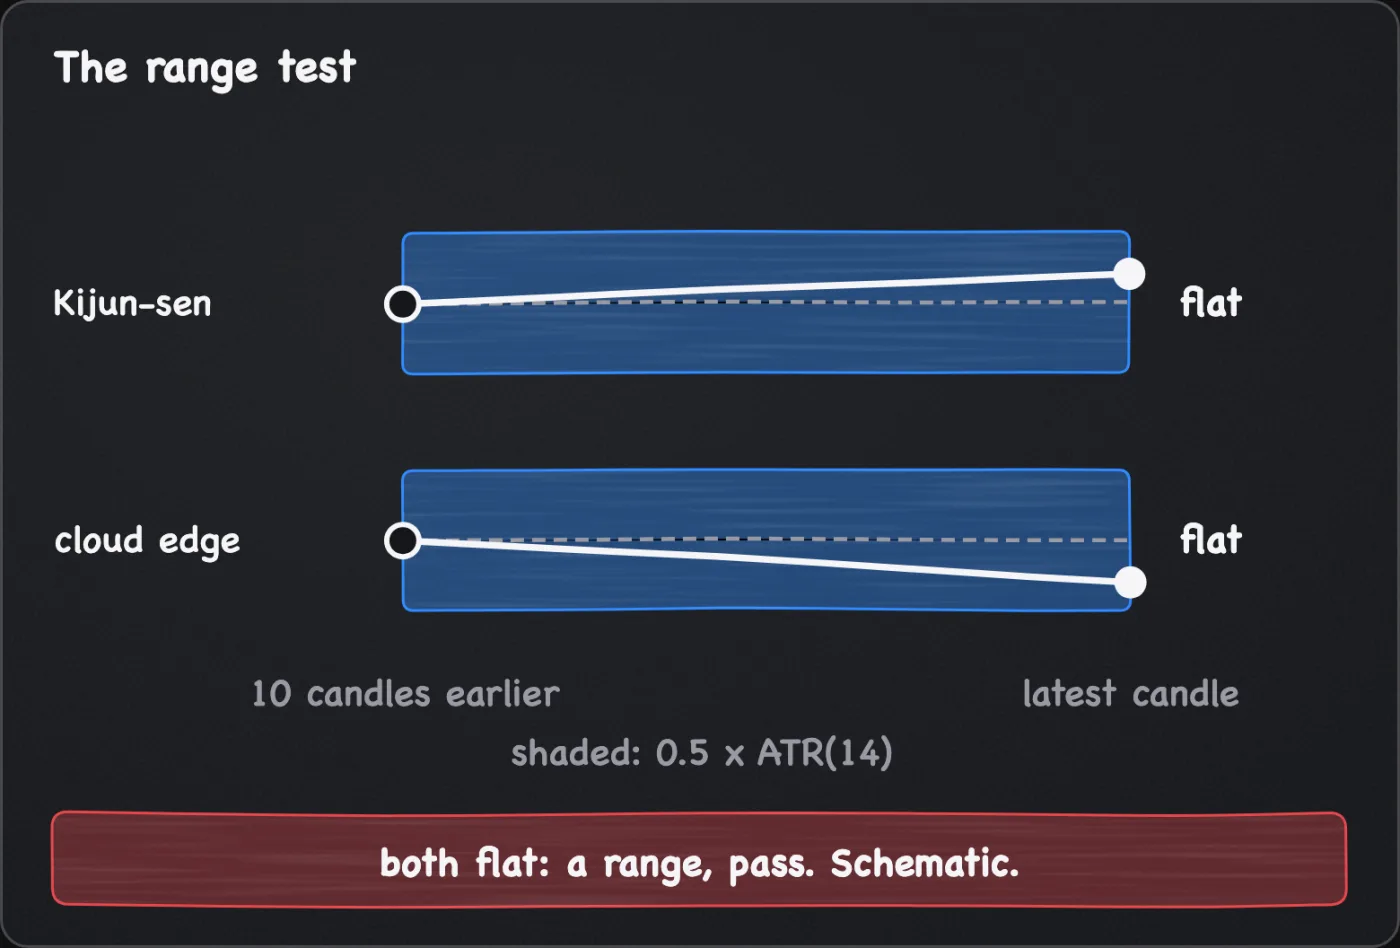
Flat lines are this manual's marker of a range. The test, with the thresholds as house choices: the Kijun-sen and the cloud edge under price each differ from their value 10 candles earlier by less than 0.5 x ATR(14), measured at the latest candle. When both are flat, treat the market as a range and pass on the Ichimoku setups. This also skips a breakout out of a long range while both lines are still flat. A looser threshold passes more charts as ranges, and a tighter one fewer.
Three agreeing lines are one reason
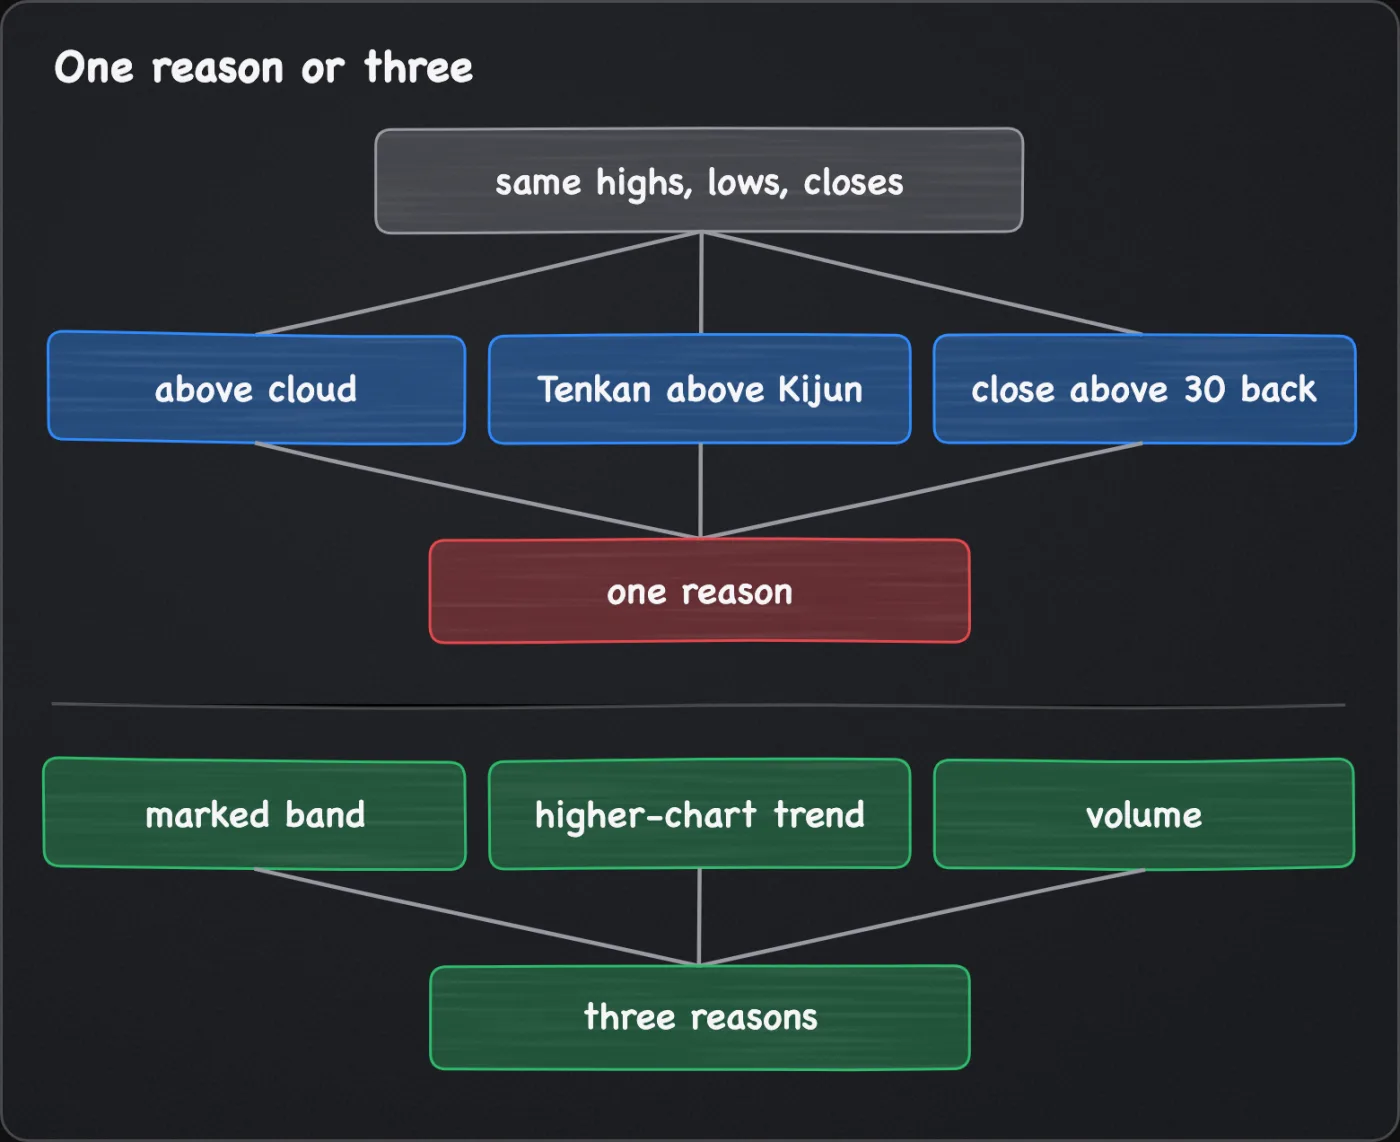
Every line comes from the same highs, lows and closes. In an advance, price rises above the cloud, the Tenkan-sen rises above the Kijun-sen, and the latest close rises above the candle 30 back, all because price rose. Three Ichimoku checks agreeing is close to one reason shown three ways. The indicators overview makes the same point about RSI and MACD. A marked support or resistance band, a trend on a higher chart and a volume condition are unrelated kinds of reason. Count those separately.
Default settings
| Item | Value | Status and limitation |
|---|---|---|
| Published default | 9, 26, 52, 26: Tenkan-sen 9, Kijun-sen 26, span B 52, shift 26 | The original design, and what most charting platforms load by default. Using it unchanged is also a choice, and this page cites no test of it. |
| This manual's choice | 20, 60, 120, 30 | A house choice for markets that trade around the clock, with no test behind it. Longer lookbacks tend to make the lines slower and flatter, put the Kijun-sen further from price (so stops sit further out) and give fewer signals. |
| Platform input names | Conversion Line, Base Line, Leading Span B, and a lagging span or displacement input | Labels differ by platform. On many, one shift input moves the cloud forward and the Chikou span back. Some have no shift input and shift by the Kijun-sen length, and some have two. Check all four numbers, and check that the cloud ends 30 candles past the last one. |
| Variation: your own set | Fixed before you look at a chart | Any set is a choice. Use the same four numbers on every chart you compare, and do not retune them after a miss. |
How it is used in this manual's setups
- Kumo breakout long. The first close above the cloud, with the Kijun-sen and the Chikou span agreeing. The Kijun-sen sets the stop and the exit.
- Tenkan-sen and Kijun-sen cross short. A cross below the cloud with a red cloud ahead.
- Kijun-sen reclaim long. A dip below the Kijun-sen in an uptrend, entered on the close back above it.
Each applies the cloud on the decision timeframe, with a higher chart for context, as multi-timeframe analysis sets out. They are separate plans with separate exits. A second entry on a coin while one is open is a new trade with its own stop and size, and it adds to total planned loss, as portfolio risk sets out.
Common mistakes
- Reading the platform default by accident. Most charts load 9, 26, 52, 26. Open the inputs and set all four numbers.
- Treating the cloud ahead as a forecast. It is past data shifted forward. Describe it as what the lines say now.
- Counting Ichimoku checks as separate reasons. Add a level, a higher-chart trend or a volume condition instead.
- Acting on a cross before the candle closes. The lines move until the close, and a cross can disappear.
- Trading inside the cloud. The table says pass. A signal there sits between two lines that disagree.
- Retuning after a miss. A set fitted to the last move may not fit the next. Fix it once.
What this cannot tell you
- Where price goes. The lines are built from past candles. A close above the cloud says what price did, not what follows. The cloud ahead is past data shifted forward, not a resistance at that future price and time.
- Whether a thick cloud holds. Thickness is a gap between two midpoint lines. This page cites no test that a thick cloud stops price more than a thin one.
- Whether a flat Kijun-sen pulls price back. The idea that price returns to it is a belief, and this page cites no test of it.
- That flat means a range. The range test is a house filter. Lines can be flat for other reasons, and a breakout can start while they are.
- What happened inside a candle. Conditions built on closes, the Chikou span among them, do not describe the sequence within a candle, so they cannot show a wick that sweeps a level and reverses.
- Whether 20, 60, 120, 30 beats 9, 26, 52, 26. The house settings are a choice, with no comparison cited.
Questions
What are the best Ichimoku settings for crypto?
No best setting is established here. The published default is 9, 26, 52, 26. This manual uses 20, 60, 120, 30 as a house choice for markets that never close and cites no test of either. Pick one, write it down and keep it.
Is Ichimoku a complete trading system?
It gives a reading of trend and range, and lines to use as references. It does not size a position, price the costs or say when you are wrong. Those still come from position sizing, trading costs and liquidity and stop-loss placement.
Which timeframe does the cloud suit?
There is no right one. A higher chart prints fewer crosses, and the lines sit further from price in absolute terms, so stops are wider and positions smaller for the same planned loss. This manual's examples assume a 4-hour decision chart with a daily chart for context.