Definition
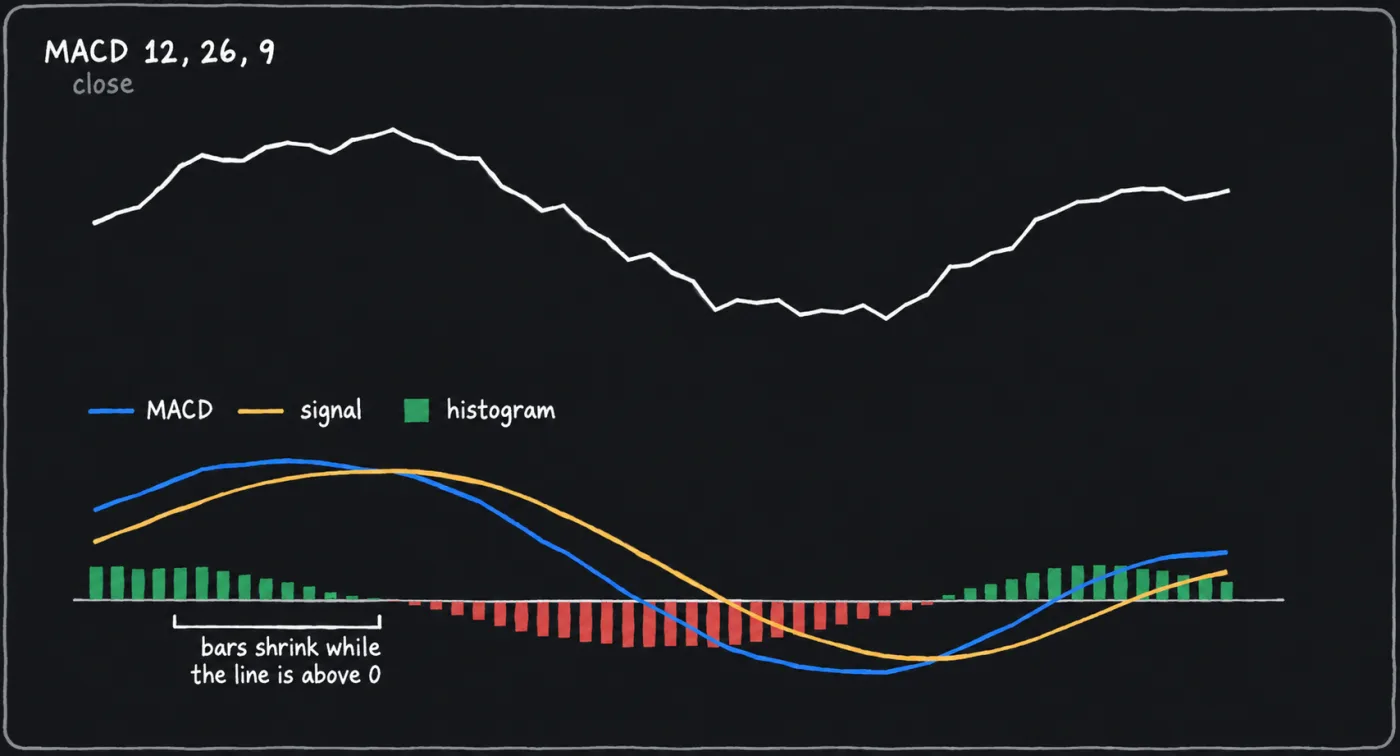
The default MACD setting is 12, 26, 9. The MACD line is the 12-candle EMA of closes minus the 26-candle EMA, the signal line is a 9-candle EMA of the MACD line, and the histogram is the MACD line minus the signal line. Moving Average Convergence Divergence was developed by Gerald Appel in the late 1970s. No crypto-specific setting has been established.
It measures how far a fast average has pulled from a slow one, and whether that gap is widening or closing. Use it to decide whether the momentum behind a move is still growing, as one condition in a plan and never as a trigger.
How it works
Three series from one price
The MACD line is EMA(12) minus EMA(26) of the closing price. It is in price units, positive when the fast average is above the slow one and negative when it is below, and it crosses zero at the candle where the two EMAs cross each other, for any fast and slow lengths. The signal line smooths the MACD line, and the histogram shows the gap between them. The smoothing factors come from the EMA formula on the moving averages page: 2 / 13 for the 12, 2 / 27 for the 26 and 2 / 10, which is 0.2, for the signal.
A worked update, for arithmetic only. Assume the MACD line is 2.0 and the signal line is 1.5, so the histogram is 0.5. On the next candle the MACD line falls to 1.9. The signal moves to 0.2 x 1.9 + 0.8 x 1.5 = 1.58, and the histogram is 1.9 minus 1.58, or 0.32. The histogram fell from 0.5 to 0.32 while the MACD line was still positive and still above its signal. The histogram measures the MACD line against its own signal average, so a positive bar can shrink while the line is still above zero, and it can shrink while the line itself is rising more slowly than its average. Price may be rising more slowly, flat or falling, and the histogram alone does not say which.
Reading it
There are three common readings, and each is a condition to write into a plan. They are different events, and none has a fixed place in time relative to the others.
- Signal crossover. The MACD line crosses its signal line, which is the histogram crossing zero.
- Zero-line crossover. The MACD line crosses zero, which is the 12 EMA crossing the 26 EMA.
- Histogram shape. Compare the histogram's peak at two successive price swings of the same kind, the same way as on the RSI divergence page. Smaller bars at a new price extreme are one MACD form of divergence. Some traders compare the MACD line's peaks instead. Say in the plan whether you read bars by signed value or by size.
MACD is in price units, so a reading means something only for one coin on one timeframe. A percentage version, PPO, divides the gap by the slow EMA so coins and periods compare. Closed candles do not change. The live candle's values move until it closes, so an early crossover can vanish.
Default settings
| Setting | Values (fast, slow, signal) | When traders use it |
|---|---|---|
| Published default | 12, 26, 9 on the close | The default on charting platforms. |
| Variation: faster | 8, 17, 9 | Traders who want crossovers sooner. The lines cross more often, including in a range. |
| Variation: percentage | 12, 26, 9 as PPO | Comparing coins or periods. The gap is divided by the slow EMA and multiplied by 100. The scale is comparable, but the readings are still not equally meaningful across coins. |
The 12 and 26 were set for stock-market daily charts. This page cites no test that they suit a 24-hour crypto market, and platforms vary the averaging type and the source price, so check what your chart uses. Shorter sets react sooner and cross more often, and longer ones do the reverse. A set chosen to fit last month's turns may not fit the next.
How it is used in this manual's setups
MACD never opens a trade in this manual. It is one supporting reason beside structure. The ending diagonal breakdown lists a shrinking lower-timeframe MACD histogram on the final push as a momentum reason, one of several and not a trigger. The RSI divergence page covers the matching RSI condition.
MACD and RSI are both built from the same closing prices, so they overlap, and agreement between them is weaker evidence than two unrelated reasons. The ending diagonal setup lists them under one condition, momentum fading into the top. This page cites no measure of how much they overlap. The indicators overview lists what each indicator answers and cannot tell you.
Common mistakes
- Trading every crossover. In a range the signal line crosses repeatedly. Skip charts where the histogram flips around zero.
- Reading the histogram as direction. A shrinking bar says the MACD line is closing on its signal, not that price is falling.
- Comparing raw values across coins. The scale is price units. Use PPO or read each chart alone.
- Acting on the live candle. Wait for the close or the crossover can disappear.
- Stacking MACD with RSI as two independent confirmations. They come from the same closes, so read their agreement as overlapping evidence, not two separate reasons.
- Changing the set after a miss. A set chosen after the move is fitted to it.
What this cannot tell you
MACD cannot tell you which way price goes next. It is two lagging averages and their gap. A crossover is built from averages of past closes, so it does not show that the price swing itself has turned. In a trend the histogram can shrink and recover several times, and in a range it flips around zero without a trend to follow. It cannot say how strong a move is across coins, because its scale is in price units. And it ignores wicks, because every input is a close.
Questions
What are the best MACD settings for crypto?
No setting is best. The default is 12, 26, 9, and it was set on stock charts. Faster sets such as 8, 17, 9 cross sooner and cross more often in a range. Pick one, write it in the plan and keep it across the charts you compare.
What does the MACD histogram show?
The gap between the MACD line and its signal line. It grows when the MACD line pulls away from the signal and shrinks when it closes in. It says nothing on its own about whether price will turn.
Is MACD better than RSI?
Neither is better. MACD describes a gap between two averages, and RSI compares average gains with average losses. Both come from closing prices, so they overlap. Choose one for each question and write it into the plan.