Definition
The default RSI setting is a length of 14 with bands at 70 and 30. The Relative Strength Index compares smoothed average gains with smoothed average losses, starting from 14 closing-to-closing changes, and scales the result from 0 to 100. Divergence is a disagreement between the price swings and the RSI swings at the same two points. J. Welles Wilder Jr. introduced RSI in 1978.
Use it to decide whether momentum is confirming a swing, as a reason to wait or to look at structure, and never as a signal by itself.
How it works
The RSI formula
RS is the average gain divided by the average loss over n candles, and RSI = 100 minus 100 / (1 + RS). Each candle's change from the previous close counts as a gain if it is up, with a loss of 0, and as a loss if it is down, with a gain of 0. The averages use Wilder's smoothing, which platforms often label RMA: the first value is a simple average of the first 14 changes, which needs 15 closes, and each later one is (13 x previous average + current change) / 14. Older candles never drop out entirely.
For arithmetic only, assume an average gain of 1.0 and an average loss of 0.5. RS is 2 and RSI is 100 minus 100 / 3, which is 66.7. A candle that gains 3 gives a new average gain of (13 times 1.0, plus 3) / 14 = 1.14 and a new average loss of (13 times 0.5, plus 0) / 14 = 0.46. RSI rises to 71.1 when computed from the unrounded averages, so do not reuse the rounded figures. An RSI of 70 means the average gain is 2.33 times the average loss, and 30 means it is 0.43 times. A reading above 70 describes recent candles. It does not say price is about to fall. In a strong trend RSI can stay above 70 for a long time.
Regular divergence
Regular divergence compares two successive swing highs or lows in price with the RSI readings at the same candles.
- Regular bearish: price makes a higher high and RSI makes a lower high. Conventional reading: the push has less momentum behind it, so the advance may be tiring.
- Regular bullish: price makes a lower low and RSI makes a higher low. Conventional reading: the decline is weakening.
Hidden divergence
Hidden divergence compares the same pairs the other way round.
- Hidden bullish: price makes a higher low and RSI makes a lower low. Conventional reading: the pullback was rougher in momentum terms than in price terms, and the uptrend may resume.
- Hidden bearish: price makes a lower high and RSI makes a higher high. Conventional reading: the bounce was stronger in momentum terms than in price terms, and the downtrend may resume.
Each of these is a hypothesis to write into a plan. By convention, traders read regular divergence as a possible pause or reversal and hidden divergence as a possible continuation. Both readings can be wrong, and the plan should say what structure must also appear.
Where it fails
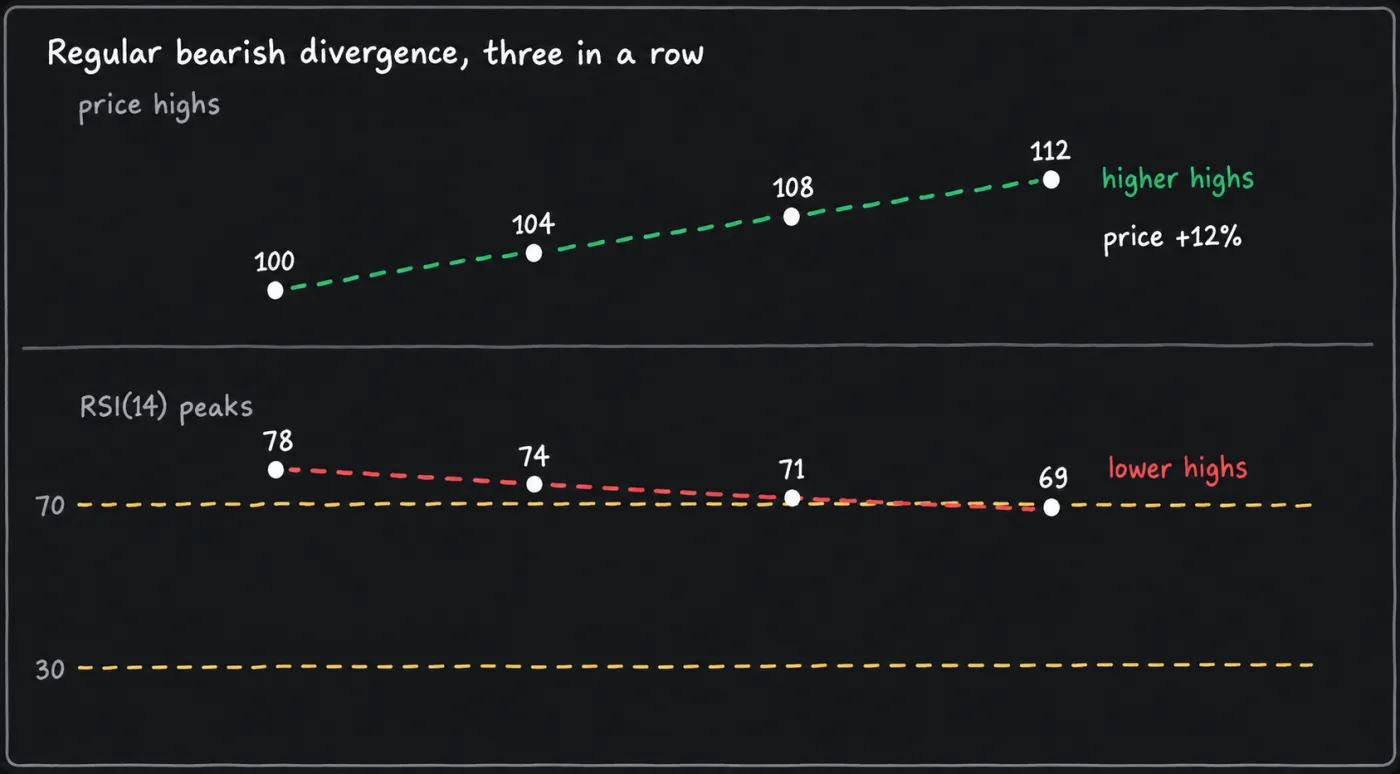
A trend can print divergence again and again while price keeps going. Assume price highs of 100, 104, 108 and 112 with RSI peaks of 78, 74, 71 and 69. That is three bearish divergences in a row, and price rose 12% through all three. Divergence can also be unreadable in a vertical move, where RSI sits near its top and offers no lower peak to compare.
It is only known late. A swing high is confirmed only after price has turned away from it, by however many candles your swing rule requires, so a divergence label appears after the second peak and not at it. Indicators that mark it live may draw one that disappears. Which two swings you compare is also a judgement, because several peaks can be picked from one move. This page cites no test of divergence against chance on perpetual futures.
A usable plan puts structure beside the divergence. For example, wait for a close below the last higher low before treating a bearish divergence as more than a note. Divergence alone supports waiting.
Default settings
| Setting | Value | When traders use it |
|---|---|---|
| Published default | RSI(14) on the close, Wilder smoothing, bands at 70 and 30 | Wilder's definition and the default on the major charting platforms. |
| Variation: shorter length | 7 to 9 | Reacts sooner and touches the bands more often, including on moves that do not turn. |
| Variation: longer length | 21 to 25 | Smoother and slower, so the bands are touched less. |
| Variation: wider bands | 80 and 20 | Fewer touches, for traders who find 70 and 30 too frequent in a trend. |
RSI changes with the chart. The same length of 14 covers 14 minutes on a 1-minute chart and 14 days on a daily one, so the readings are not comparable across timeframes. Platforms vary the smoothing type and the source price, so check what yours uses. No setting is best, and one chosen to fit last month's turns may not fit the next.
How it is used in this manual's setups
The ending diagonal breakdown lists a lower RSI peak on wave 5 than on wave 3 as one of several conditions, never a trigger. The fifth wave exhaustion short and the oversold bounce long are the other setups on this theme. The bounce setup acts only after a separate confirmation and never on the first touch of an oversold reading.
The same idea works on the MACD histogram, covered on the MACD page. Both use the same closes, so they overlap, and agreement between them is weaker evidence than two unrelated reasons. The indicators overview puts the two side by side.
Common mistakes
- Shorting every overbought reading. A reading above 70 describes recent candles and in a trend it can persist. Look for structure first.
- Calling divergence a signal. It is a hypothesis. Write the structure condition that must also appear.
- Comparing the wrong peaks. Use two successive swings of the same size, not a peak and a smaller bounce.
- Acting on an unconfirmed swing. Wait until the second swing has turned, or the label may vanish.
- Ignoring the trend. In a strong trend a regular divergence can repeat several times.
- Stacking RSI with MACD as two independent confirmations. Both come from the same closes, so read their agreement as overlapping evidence, not two separate reasons.
What this cannot tell you
RSI(14) is built from closing prices, so it cannot see a wick that sweeps a level and reverses. A divergence cannot tell you that a trend has ended, because trends can print several in a row. It cannot say how long the disagreement will last or which swings to compare. And no reading of 70 or 30 says what price does next.
Questions
What are the best RSI settings for crypto?
No setting is best. The default is RSI(14) with bands at 70 and 30. A shorter length reacts faster and touches the bands more often, and a longer one is steadier. Fix one in the plan and keep it across the charts you compare.
What is hidden divergence?
Price and RSI disagree in the other direction. A hidden bullish divergence is a higher low in price with a lower low in RSI, and a hidden bearish one is a lower high in price with a higher high in RSI. By convention it is read as a possible continuation, and it can fail.
Does RSI divergence work?
This page cites no test of divergence against chance on perpetual futures. It describes a disagreement in momentum and nothing more. Use it as one condition in a plan, beside structure.