Definition
Fibonacci retracement draws horizontal lines at fixed fractions of a finished move, usually 0.236, 0.382, 0.5, 0.618 and 0.786, as candidate places to check for a reaction during a pullback. Extension levels such as 1.272 and 1.618 are projected from three points on a swing and give candidate target areas.
This is an optional, discretionary approach. Careful traders use plain levels and structure alone, and two of them can anchor the same chart differently and draw different lines. Use it to decide where a plan checks for a reaction, or whether to skip the lines and work from structure.
How it works
Where the ratios come from
Divide a number in the Fibonacci sequence (1, 1, 2, 3, 5, 8, 13, 21, 34, 55, 89) by the next one and the answer settles near 0.618, as 34 / 55 does. Divide by the number two places on and it settles near 0.382 (21 / 55). Three places on gives 0.236 (13 / 55). Put another way, 0.382 is about 0.618 squared, 0.236 about 0.618 cubed and 0.786 about its square root. The 0.5 line is not from the sequence. It is the halfway mark, kept by convention.
That is the whole origin. The arithmetic produces the numbers and says nothing about why a market would care about them, so treat the lines as drawing conventions, not forces. A common explanation is that many traders chart the same lines, so orders cluster there. This page cites no test of that, or of whether price pauses at these lines more often than at arbitrary prices.
Drawing a retracement
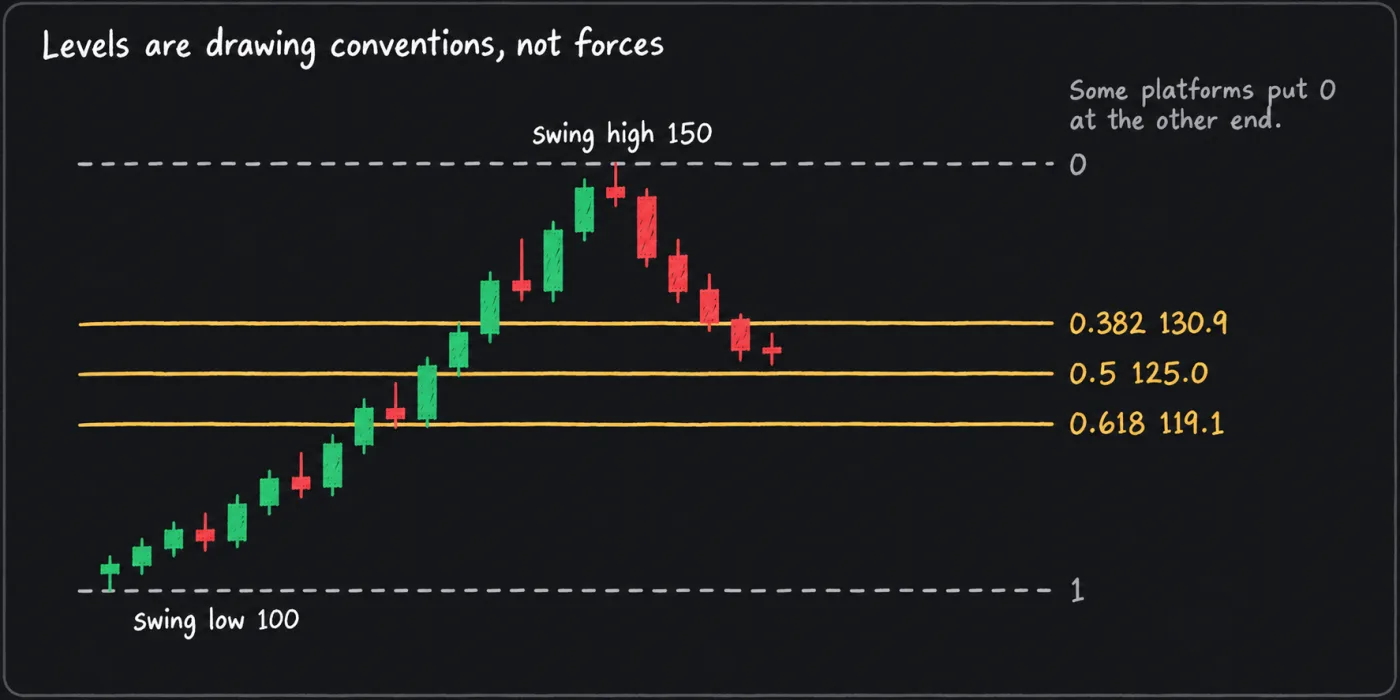
For an up move from a swing low L to a swing high H, the line for ratio r sits at H minus r x (H minus L). For a down move it sits at L plus r x (H minus L), counted back up from the low. For arithmetic only, assume a swing low of 100 and a swing high of 150, a range of 50.
| Ratio | Line price |
|---|---|
| 0.236 | 138.2 |
| 0.382 | 130.9 |
| 0.5 | 125.0 |
| 0.618 | 119.1 |
| 0.786 | 110.7 |
Platforms differ on which end they label 0, so check that your tool matches the formula. Three choices change the lines: the anchors (wick extremes or bodies), the span (the whole move or its last leg) and the price scale. If the tool interpolates in log price, a move from 100 to 400 puts the 0.5 line at 200, where a linear scale puts it at 250. Switching a chart to log display does not always change how a tool computes its levels, so check yours. Fix all three in the plan, and write the anchor prices down before the pullback is over. Lines drawn after a bounce are hindsight.
Reading the lines
Five lines leave little room between them. In the example, a pullback that ends anywhere from 110.7 to 138.2 stops within 4.2 of one of them, under a tenth of the 50-point move. That says how close a pullback ending in that range must land to some line, and nothing about how real pullbacks are distributed. It does mean a bounce near a line is weak evidence that the line mattered. A line that sits on a level the chart already had, such as an old swing high or low (see support and resistance for marking those), has a second reason behind it. Even then it marks a place to look for a reaction, not a price where the pullback must end.
Some traders call the zone from 0.618 to 0.65 the golden pocket. That is a name for a zone on the chart. This page cites no evidence that price behaves differently there.
Extensions
The trend-based extension tool takes three points: the start A and end B of a move, and the end C of the pullback after it. For an up move, the line for ratio r sits at C plus r x (B minus A). For a down move, subtract r x (A minus B) from C. Assume A at 100, B at 150 and C at 130. The move AB is 50, so the 1.0 line is 180, 1.272 is 193.6, 1.618 is 210.9 and 2.618 is 260.9. Here 1.272 is about the square root of 1.618, and 2.618 is about 1.618 squared. Some platforms also let you stretch the retracement tool past 1. On a tool that puts 0 at the end of the move, as the formula above does, levels past 1 project beyond the start of the move. A tool or drawing order that puts 0 at the start projects them beyond the end instead, so check which end your tool calls 0 before reading any level above 1.
An extension line is a place to check a target. If it sits beyond the next real resistance, the resistance comes first.
Default settings
| Setting | Levels | When traders use it |
|---|---|---|
| Common platform levels (convention) | Retracement 0, 0.236, 0.382, 0.5, 0.618, 0.786, 1 | The usual starting set on charting platforms. Check what yours plots. |
| Extension levels (convention) | 1, 1.272, 1.618, 2.618 | Projecting a target from a three-point swing. |
| Variation: fewer lines | 0.382, 0.5 and 0.618 only | Less clutter, and fewer lines means fewer chances for a bounce to look like a hit. |
| Variation: log scale | The same ratios computed on log price | Moves of several times the starting price, where the linear and log lines sit far apart. |
No ratio is set by the sequence as a default for crypto. Treat the set as a menu, and fix the lines you will use before looking at the chart.
How it is used in this manual's setups
The ending diagonal breakdown anchors a retracement at the start of wave 1 and stretches it to the wave 5 peak. It treats 0.236 as an early partial, 0.382 as the first main target and 0.618 as the deeper one. The wave one dip buy uses the lines to mark where a pullback after a first wave gets checked. Both belong to the discretionary wave approach in Elliott Wave, which has its own page.
In none of them does a Fibonacci line set the stop. The stop goes where the idea is wrong, as stop-loss placement explains, and the line only decides where to look.
Common mistakes
- Drawing after the bounce. Mark the anchors and the lines you will use before the pullback ends, and put the prices in the plan.
- Anchoring on the last leg only. Choose the span the plan is about and keep it. The ending diagonal setup spans all five legs.
- Putting the stop on a ratio. A line has no link to where the idea fails. Place the stop beyond the structure level, then size from it.
- Calling a near miss a hit. Write down what counts as a reaction, such as a close back away from the line, before the pullback arrives.
- Switching scales to fit. Pick linear or log once. Changing it after the fact moves the lines to wherever price went.
- Adding lines until one fits. Every extra line raises the odds that one sits near a bounce. Keep the set small.
What this cannot tell you
It cannot tell you that a pullback will stop at any line. The ratios come from a number sequence, not from anything in the market, and this page cites no test of whether price pauses at them more often than elsewhere. It cannot say where to anchor, so two traders get different lines from one chart. A bounce at a line is weak evidence on its own, because five lines sit close enough together that a pullback ending between the outer two lands near one. And it gives no invalidation: the price where the idea is wrong comes from structure.
Questions
What are the Fibonacci retracement levels?
The usual set is 0.236, 0.382, 0.5, 0.618 and 0.786, drawn between the start and end of a move. Four of them are approximately powers or roots of 0.618, and 0.5 is the halfway mark.
Which Fibonacci level is best for crypto?
No level is best. Each is a drawing convention. Fix a small set before you look at the chart, and treat any reaction at one as a reason to look closer, not as a forecast.
How do you draw a Fibonacci retracement?
Click the swing low and swing high of the move the plan is about, in the order your tool expects, and check which end it calls 0. Write the anchor prices into the plan, and use the same price scale each time.