Definition
Support is a price zone where falling price has stalled or turned up before. Resistance is a zone where rising price has stalled or turned down before. Traders draw them as lines or as bands. This manual marks bands, because turning points rarely land on one price, and both are read off past candles.
Use it to decide where a plan's trigger, stop and target sit, and whether a trade has room before the next zone.
How it works
Why traders expect a level to matter
The usual explanation is memory and orders. Price turned there once, so some traders have orders resting near it, some bought or sold there and watch the price they paid, and stop orders sit just beyond it. When price comes back, those orders can meet it. That is a story about behaviour, and this page cites no test showing that price reacts at marked levels more often than at unmarked prices. Treat a level as a place where your plan has a visible condition, not a place where price must react.
Marking a zone
Start on the chart you read for the larger trend, then check your decision timeframe, as multi-timeframe analysis sets out.
- Mark the swing highs and lows where price clearly turned. A swing is only known once price has moved away from it, so the newest turning point is provisional.
- Group turning points that sit near the same price into one candidate.
- Draw a band, not a line. One common convention runs the band from where candle bodies cluster to the furthest wick tip. Another fixes the total width in advance, for example as a fraction of ATR(14) around the turning points. The width is its own choice, separate from the stop buffer.
- Count the touches: separate turning points inside the band, where price leaves the band and later comes back. Fix a minimum gap in candles, so neighbouring candles do not count as separate touches. Two touches make a candidate, and a common convention asks for three before calling it a level. Both are conventions.
- Write the band down as two prices, with the timeframe and the date.
More touches can mean more orders resting there, or orders already used up. Both stories are told, and this page cites no test of either. Fix the band's width and the touch count before you look at the next candle, or the level gets adjusted to fit whatever price just did.
A band, not a line
Assume a resistance band marked from 100, where bodies cluster, to 102, the highest wick, and ATR(14) of 2. A short plan is wrong if a candle closes above the band, so the invalidation is 102. With an assumed buffer of 0.5 x ATR(14), the stop order goes at 103 (stop-loss placement covers both the close rule and the buffer). For arithmetic only, assume an entry at 98 on a 10,000 account with a planned loss of 1%, or 100, costs left out. The stop is 5 away, so the position is 20 units.
Marked as a single line at 100, the same method puts the stop at 101, 3 from entry, and the position at 33.3 units. That is about two thirds more size, bought by putting the stop inside the band, where price is still trading and the idea is alive. A band costs size and puts the stop where being wrong means something.
When a level changes sides
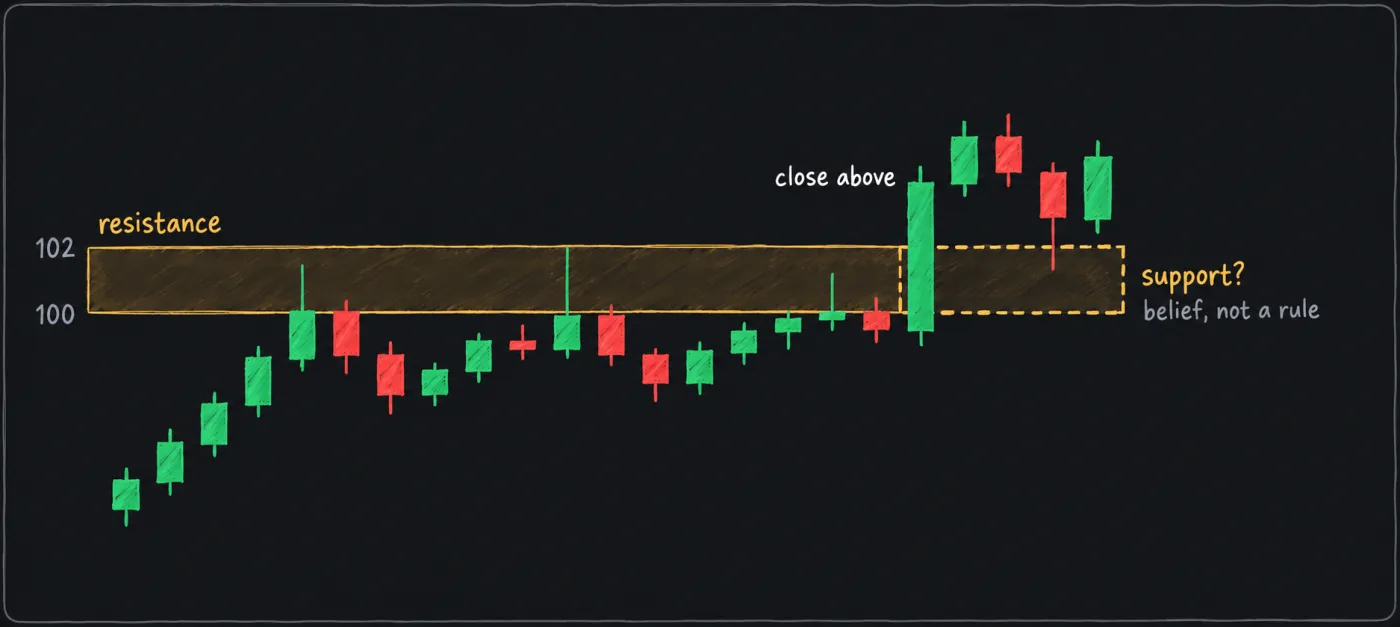
A broken support can act as resistance when price returns to it, and a broken resistance as support. The mechanism offered for the first: traders who bought at the old support and sit underwater may sell near break-even when price comes back, and new shorts anchor on the break. The mirror holds for the second, with shorts buying back. It is a belief with a plausible mechanism, not a promise. Price can run through an old zone without pausing.
If you use it, write the condition: after a close beyond the band on your decision timeframe, treat the band as the other side until a close back through it, which means the role change failed. Breakouts and retests covers the retest itself.
Room to the next level
The next zone in the trade's direction is an obstacle between entry and target. A target beyond a zone that price must cross first improves the ratio on paper only. The distance to the target against the stop distance is the ratio that risk to reward measures.
Default settings
This page cites no published default for marking a level, so the table lists common conventions. Each is a choice you write into the plan, and none is this manual's rule.
| Item | Convention | Status and limitation |
|---|---|---|
| Shape | A band from where bodies cluster to the furthest wick tip | Common convention. A wide band gives the stop more room and shrinks the position, and a narrow one does the reverse. |
| Variation: fixed width | A set fraction of ATR(14) as the band's total width | Your choice. It needs no judgement about wicks and ignores where price actually clustered. |
| Touches | Two to make a candidate, three or more as a common threshold for calling it a level | Common convention. A higher count leaves fewer levels and more hindsight in which ones you keep. |
| Timeframe | Mark on the chart you read for the larger trend, then check the decision timeframe | Convention. A band marked on one chart can look different on another. |
| What counts as a break | A candle close beyond the band on the decision timeframe | The close rule from the stop-loss placement page. A wick alone does not count. |
How it is used in this manual's setups
Levels give a plan its invalidation and its target. The setups use them in these ways.
- Ending diagonal breakdown. One condition is that the top of the wedge sits at a marked resistance band, such as a prior high or an old support level now above price.
- Failed breakout wick short. Built around a marked level that price pushed through and did not hold.
- Fibonacci retracement. A retracement level is one more candidate price. Where it overlaps a marked band you have two reasons for the same price, which is not independent evidence that price will react.
Common mistakes
- Drawing a single line. Mark a band and put the stop beyond it, not inside it.
- Marking with hindsight. A level drawn after the move always fits. Write the band down with its date before the next candle.
- Marking everything. A chart full of bands gives you a level to cite for any trade. Keep the few the plan needs.
- Treating the touch count as odds. Three touches says how many times price turned, not how likely the next turn is.
- Calling a wick through the band a break. Use the close rule, then read what follows.
What this cannot tell you
- Whether price will react at the band or run through it. A level is a price where your plan has a condition. It carries no prediction.
- That the band is the right one. Two traders can mark different bands on the same chart, and a band drawn after the move always looks right. This page cites no test of marked levels against chance.
- Whether a wick through the band is a break or a sweep. Stop orders resting just beyond a level can trigger and price can still reverse. Your close rule decides which one you call it. What follows can only show, afterwards, whether the break held.
- Which band matters most. A chart can hold several, and nothing here ranks them by how likely price is to react.
Questions
What is support and resistance in trading?
Zones where price has turned before, support below the current price and resistance above it. Traders mark them to place triggers, stops and targets. A marked zone is a reference for the plan, not a forecast.
How many touches make a support level?
There is no standard. Two touches make a candidate and a common convention asks for three, both conventions. Pick a number, write it into the plan, and keep it.
Does broken resistance become support?
It can. The usual reason given is that short sellers who sold at the old resistance, underwater after the break, buy back near break-even when price returns, and new buyers anchor on the break. Price can also pass through without a pause, so treat it as a condition to check on the candles after the break.