Definition
Multi-timeframe analysis means reading one coin on two or three chart timeframes, each for a different job. A higher timeframe gives context: the larger trend and the main levels. Your decision timeframe holds the plan. A lower one can time the entry or check a wick.
Use it to decide whether a plan on your decision timeframe has room to work given the larger chart, and whether to wait, accept a lower planned loss or pass.
How it works
Same price, different resolution
A 4-hour candle is four 1-hour candles joined, or 48 five-minute candles. Higher timeframes show the larger swings and hide detail. Lower ones show detail and more noise. All of them are cuts of the same trades on the same exchange, on candle boundaries that line up, so two timeframes that agree are not two independent pieces of evidence. A rising 4-hour trend and a rising 1-hour trend are largely the same rise seen at two scales.
A higher-timeframe candle that has not closed is still changing, so read the last closed candle, not the one in progress.
Three jobs
| Job | Question | Example, assuming a 4-hour decision timeframe |
|---|---|---|
| Context | What is the larger trend, and where are the big levels? | The daily chart |
| Decision | Is the plan's trigger met? | The 4-hour chart |
| Timing, optional | What happened inside this candle? | The 1-hour or 15-minute chart |
The decision timeframe is the candle your plan is read on. Everything with a candle in it is written on that chart: the trigger, the close rule, ATR(14) for the stop buffer and the size, and the correlation window that portfolio risk uses. The context chart can end a plan before it starts, or lead you to write a lower planned loss. It cannot move where the idea is wrong: a level carried down from it is re-marked and written on the decision chart, and only a decision-chart close proves the idea wrong. The timing chart can change when you act on a trigger the decision chart has met. Its close never stands in for a decision-chart close that has not printed.
The stop-loss placement page has one lower-timeframe check, and it works only for leaving early: a strong close through the level on the 1-minute or 5-minute chart is a reason to exit before the higher candle closes. It is that page's own judgement call and this page cites no test of it.
The ratio between charts
A common convention, from Alexander Elder's Triple Screen method, which gives each of three timeframes a separate job, keeps each chart about five times the next. On crypto's seven-day week that works out at roughly 4 to 7: daily over 4-hour is 6, 4-hour over 1-hour is 4, 1-hour over 15-minute is 4, and weekly over daily is 7, the pair the trading mindset chapter's example uses. Elder's five came from a five-day stock week. These are conventions, not rules. A ratio near 1 gives two charts that say nearly the same thing. A very large one gives a context chart that may say little about the decision candles. Write your pair in the charter.
Fit the decision timeframe to the hours you can watch. A 4-hour candle closes six times a day and a daily candle once, at a time the platform sets, commonly 00:00 UTC. If you look once a day, you can act promptly on at most one of a 4-hour plan's six closes. Trading mindset has the scheduling check.
Write the conflict rule first
When the charts disagree, decide in advance what happens. Giving the higher chart more weight is a common convention, not a tested one: this page cites no test that higher-timeframe agreement improves results. The ending diagonal breakdown setup uses it as the tie-break for its wave count. Whatever you choose, write it as a pass condition, so that it is applied before a trade looks good and not after.
Hypothetical walkthrough: a trigger the daily chart turns down
Hypothetical walkthrough. Invented prices and an invented outcome, chosen to teach the decision. Not a recorded trade, and not evidence of how often this setup works.
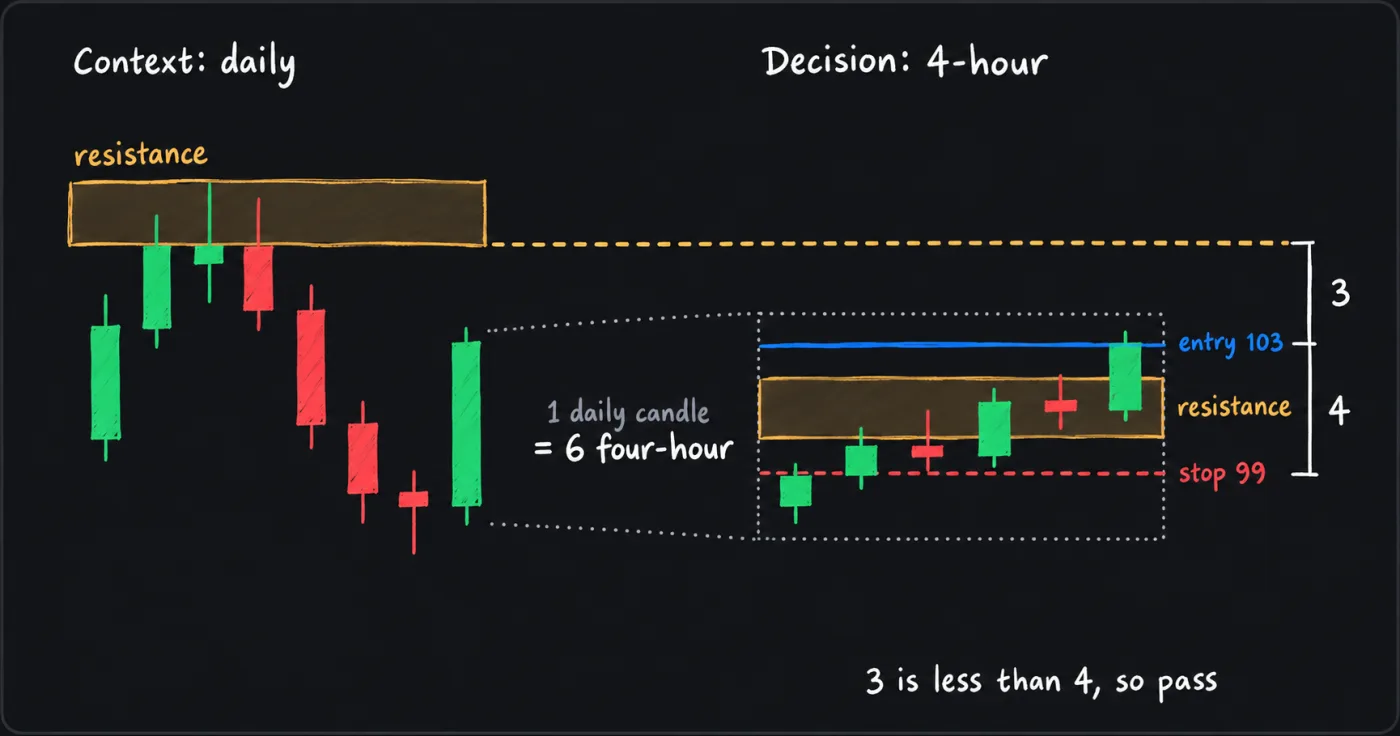
Assume a plan on the 4-hour chart: a long if a candle closes above a resistance band at 100 to 102. A 4-hour candle closes at 103, so the trigger is met. Assume an entry at that close, 103. The idea is wrong if a candle closes back below 100, and with ATR(14) at 2 and an assumed buffer of 0.5 x ATR(14) the stop order goes at 99, 4 below entry.
Before sizing, the reader checks the daily chart. A daily resistance band sits at 106 to 108, 3 above entry. The reader's plan, written earlier, says: pass if the nearest daily resistance is closer than the stop distance. 3 is less than 4, so the condition is met. They log "pass: daily resistance 3 away, stop 4 away" and calculate no size.
The test and its numbers are this reader's. The manual sets no such figure. The outcome was chosen to show the context chart ending a plan with a clean decision-timeframe trigger, before any size existed.
Default settings
This page cites no published default for choosing timeframes, so the table lists common conventions and this manual's own references. Each is a choice you write into your charter.
| Item | Convention | Status and limitation |
|---|---|---|
| Number of charts | Two or three: context, decision, and optionally timing | Convention. Each extra chart is another view of the same trades and another thing to reconcile. |
| Ratio | Context about 4 to 7 times the decision timeframe | Common convention, after Elder's factor of about five. Weekly over daily is 7 in crypto. No ratio has a tested edge on this page. |
| Decision timeframe | One candle, matched to when you can look | This manual's pointer: the same candle holds the plan, ATR(14) and the correlation window. |
| Timing check | A lower chart such as 1 minute or 5 minutes, used to leave early on a strong close through the level | The stop-loss placement page's own check. It sets timing, not the stop. |
| When charts disagree | A rule you write in advance, such as pass, or a lower planned loss | Convention to weight the higher chart. A lower planned loss is always allowed. |
How it is used in this manual's setups
Every plan names its decision timeframe, and the context chart supplies the levels and the larger trend. Support and resistance gives the levels carried down from the higher chart. The ending diagonal breakdown is usually read on one hour or higher, with the higher chart winning a disagreement on the count. The observe step of the decision cycle asks for a note on each coin's trend and nearby levels on your timeframes, and the charter's Timeframes line fixes which ones. Moving averages are one way to put a trend into words on the context chart.
Common mistakes
- Shopping for a chart that agrees. Cycling timeframes until one supports the idea turns the check into a search. Write the pair first.
- Counting agreement as confirmation. The charts are cuts of the same trades. Agreement means no pass condition fired.
- Reading an unfinished candle. Use the last closed candle on the context chart.
- Taking ATR from the wrong chart. Read ATR(14) on the decision timeframe, as the ATR page says.
- Letting the timing chart move the stop. A 5-minute chart can help you act. It cannot change where the idea is wrong.
- Picking a timeframe you cannot watch. A plan that needs six closes a day cannot run on one look.
What this cannot tell you
- Which way price goes next. Agreement between timeframes describes the past. A higher chart in an uptrend does not stop a lower chart making a lower low, and a close beyond a major level can change the larger picture on the next candle.
- Which timeframe is right. The pair, the ratio and the tie-break are all choices, and this page cites no test of any.
- Whether a decision candle will close beyond the level. A close on the lower chart is not the decision chart's close, and the higher candle can still reverse before it prints.
- Whether a lower-chart wick is a sweep or a break. The lower chart shows detail sooner. It does not show what price will do next.
Questions
Which timeframe wins when they disagree?
A common convention weights the higher one. Write your answer into the plan before you trade, as a pass or a smaller planned loss, so the choice is made before a trade looks good.
Does multi-timeframe analysis make a trade more likely to work?
This page cites no test showing that it does. It makes a plan checkable against the larger chart. That can end a plan early, which is a legitimate outcome.