Definition
A trendline is a straight line through a run of swing lows in a rising trend, or swing highs in a falling one. A channel adds a second line, parallel to the first, through the opposite swings. Both are drawn by hand, so the choices behind them decide what they say.
Use it to decide whether a line is firm enough to build a plan on, and what price action will count as that line breaking.
How it works
Two points draw it, a third tests it
Any two points have a straight line through them, so a line from two swing lows proves nothing. The third touch is the first test: price came back to the line and turned. A common convention asks for one before building a plan on a line. It adds one more fit to the past, not a measured chance. Fix how close counts as a touch, for example a fraction of ATR(14). If the only line that fits cuts through many candles, redraw it or skip the chart.
Wicks or bodies
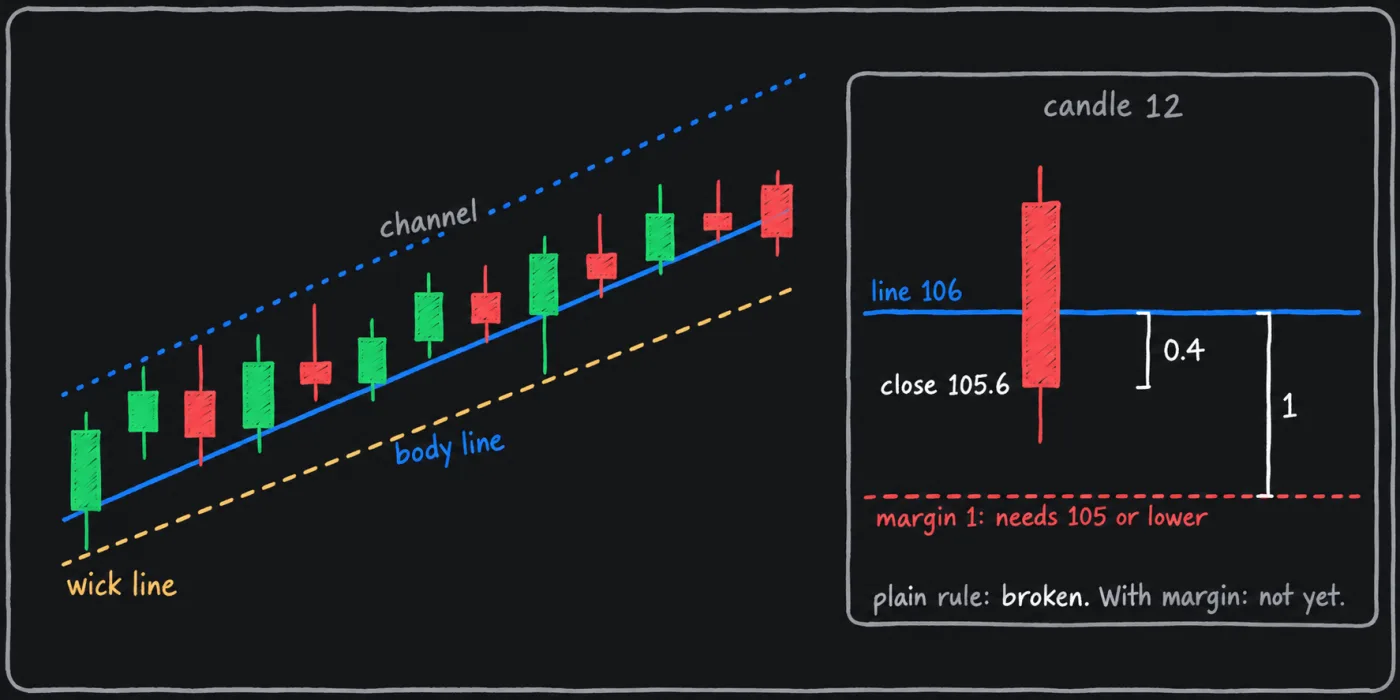
A wick line is anchored at the furthest tips. A body line is anchored at the edge of each body that faces the line: the lower of open and close for a rising support line, the higher for a falling resistance line. Neither is correct, and the choice changes what a touch and a break mean. A wick line counts a single spike as a touch, usually sits further out from the bodies, and can have a different slope. A body line is crossed by wicks all the time, so a wick through it is normal and is not yet a break. The ending diagonal breakdown setup draws its lines through bodies. Fix the choice in the plan, and use it for the touches and for the break rule alike.
Linear or log scale
On a linear scale, equal price distances look equal. On a log scale, equal percentage moves look equal. For arithmetic only, assume a line that adds 1 per candle from 100. The first step is 1%. By candle 100 the line is at 200 and the step from 199 to 200 is about 0.5%. A line that grows 1% every candle doubles in about 70 candles, and on a linear chart that line curves upward.
So the same two anchor points give a different line in between on each scale, and the difference grows with the range the line covers. Over a few percent it hardly matters. Over a move that doubles price, it does. Draw the line and read it on one scale, and write down which. The break example below is linear.
Channels
A channel is a hypothesis that both edges run parallel. Draw the trendline first, then copy it to the furthest opposite swing. If the opposite swings do not sit close to that parallel, the shape may not be a channel. Lines that converge form a wedge, and forcing parallel lines on one misleads. The far edge of a channel can inform a target the way any level can. It marks where price turned before, not where it will go.
What counts as broken
Fix the rule before the candle closes. Three common choices:
- A close beyond the line on your decision timeframe. This is the close rule from stop-loss placement, and a wick alone does not count.
- A close beyond the line by a margin, such as a fraction of ATR(14), to filter small pokes through the line.
- Two closes in a row beyond the line.
Each later rule delays the signal. Whether it removes false breaks is a separate question, and this page cites no test showing that any of them filters better than another.
Read the line at the candle's own time. Assume a rising support line through 100 at candle 0 and 104 at candle 8, a slope of 0.5 a candle, so at candle 12 it sits at 106. A candle closes at 105.6, 0.4 under it. By the plain close rule, the line has broken. With an assumed margin of 0.5 x ATR(14), and ATR(14) at 2, the margin is 1 and the close must reach 105.0 or lower, so it has not broken yet. The same candle gives a different answer, which is why the rule comes first. On a log scale the same anchors would put the line at about 106.06 at candle 12, so the scale is part of the rule. A line that price has already closed through since its second anchor is broken by your own rule. Do not build a plan on it: draw a new line from later swings, with dated anchors, or pass.
A sloped line moves every candle, and a standing stop order sits at a fixed price until you amend it. Use the line for the close rule, and put the order at a flat price beyond the swing the idea rests on, plus the buffer.
Do not redraw a line each time a candle cuts it. A line you move after every break can never be broken, so it can never say the idea is wrong. Write the anchor points, with dates, into the plan.
Default settings
This page cites no published default for drawing a trendline, so the table lists common conventions. Each is a choice you fix in advance, and none is this manual's rule.
| Item | Convention | Status and limitation |
|---|---|---|
| Anchor points | Two swing points to draw, a third touch before you build a plan on it | Common convention. A third touch is still hindsight if you picked the swings after the move. |
| Line style | Body to body, anchored at the body edge facing the line | The ending diagonal setup uses it. Variation: wick to wick, which counts a spike as a touch. |
| Scale | Log when the line spans a large percentage move, linear for a short line | Common convention. This page names no cutoff. Read the line on the scale you drew it on. |
| Channel | A parallel copy through the furthest opposite swing | Convention. If the swings do not fit, drop the channel. |
| Break | A close beyond the line on the decision timeframe | The close rule from stop-loss placement. Variations: a margin, such as 0.5 x ATR(14) as an assumed example, or two closes. |
How it is used in this manual's setups
Lines supply the trigger and the invalidation in setups built on patterns.
- Ending diagonal breakdown. Both wedge lines run through bodies. Two of its three entries wait for a close below the lower line, and the third shorts a failed double top before the break.
- Trendline break retest short. The trigger is a close through a rising line, then a retest of it from below.
- Falling wedge breakout long. The mirror: a close above the upper line of a falling wedge.
- Breakouts and retests. What to do after a line breaks, including the retest.
Common mistakes
- Fitting a line to many candles. If it cuts through bodies to catch tips, redraw it or pass.
- Mixing wicks and bodies. Draw every line the same way and break it the same way.
- Switching scales after drawing. The line reads differently on each. Draw and read it on one.
- Calling a wick through a body line a break. Apply the break rule you wrote before the candle closed.
- Moving the line after the break. Write the anchors down and keep them.
- Reading a channel edge as a forecast. It marks where price turned before. Judge a target by the room to it and the risk to reward you accept.
What this cannot tell you
- That the line will hold. A line drawn through past swings is a description. Each touch is already history, and price can cross it on the next candle.
- That a break means a trend change. A close beyond the line says the condition you wrote has been met. Price can return and cross again, and this page cites no test of how often a break holds.
- Which line is right. Wicks or bodies, log or linear, and which swings to use can all differ between careful traders, and nothing on the chart settles it.
- Where the stop fills. The line and the order are different prices, and a fast market can fill the order past its trigger.
Questions
How many touches make a valid trendline?
Two draw it, and a common convention asks for a third before relying on it. That is a convention. The line is still a description of past swings.
Should I draw trendlines on a log or a linear chart?
Log when the line covers a large percentage move, since equal percentage moves then look equal. This page names no cutoff. Either way, draw and read it on the same scale.