Definition
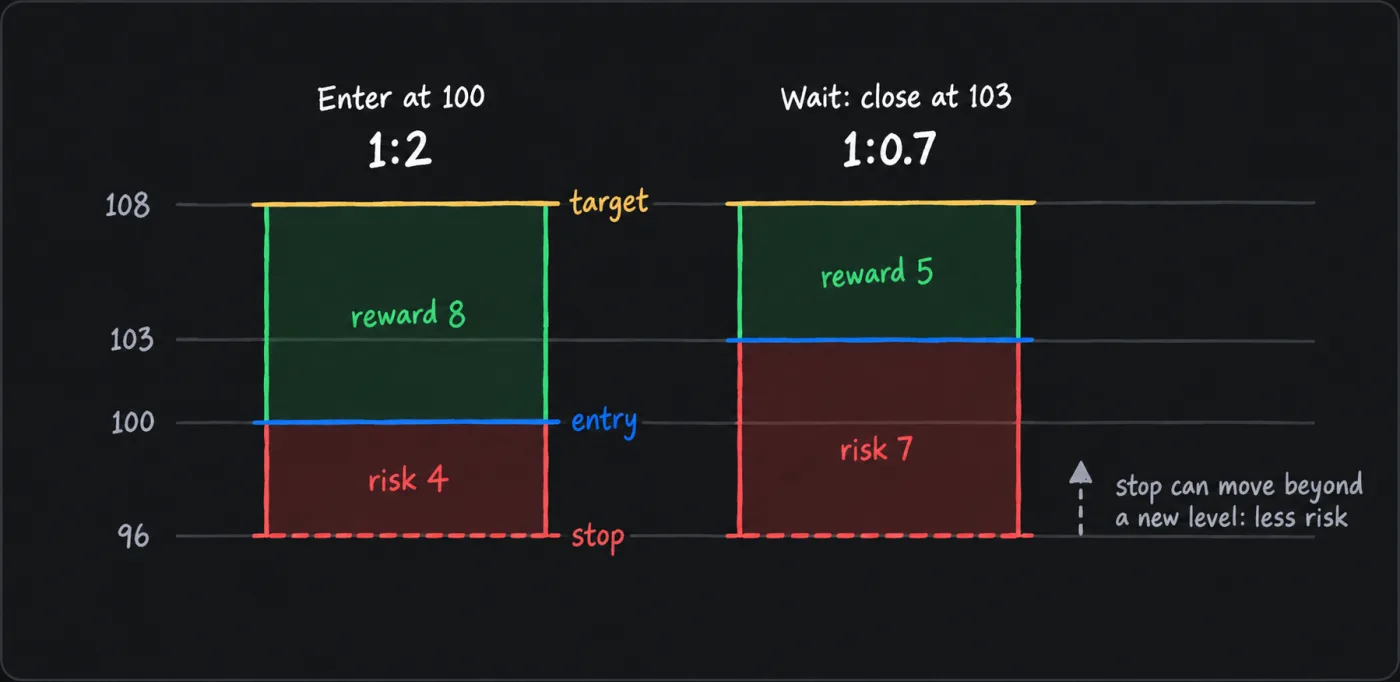
The risk to reward ratio compares the distance from entry to stop, what the trade loses if it is wrong, with the distance from entry to target, what it gains if it is right. For arithmetic only, assume an entry at 100, a stop at 96 and a target at 108. That is 4 against 8, written 1:2 or called a 2R trade.
It measures how much the target pays for the stop the trade needs. Use it to decide whether a trade is worth taking at all, once the stop and the size are fixed.
How it works
Divide reward by risk to get the R multiple. In the example, 8 / 4 is 2, so the target is 2R. This page writes the ratio risk first, as 1:2. Some traders write reward first, as 2:1 reward to risk. The trade is the same, so check which order a source uses.
Percentages give the same answer. An 8% move to the target against a 4% move to the stop is still 2. The long and short position tools on charting platforms such as TradingView draw a loss zone from entry to stop and a profit zone from entry to target, and print the ratio beside them.
Measure before you enter
You need three prices: entry, stop and target. The stop comes from the level where the idea is wrong, as stop-loss placement explains. The target comes from the chart as well, usually the previous support or resistance level in the direction of the trade, and taking profit covers how to scale out there. A target set beyond a level that price must cross first improves the ratio on paper and changes nothing about the trade. If you cannot name all three prices, there is no trade to measure.
The ratio is not the chance
The ratio says what the target pays. It says nothing about how often price gets there. Ignoring costs, and assuming every trade ends at the full stop or the full target, trades at a ratio of 1:R break even when the share that reach the target equals 1 / (1 + R). At 1:1 that is one trade in two, at 1:2 one in three, and at 1:3 one in four. This is arithmetic. This page cites no data on how often any setup reaches its target, and nobody knows that share in advance.
So the ratio and the chance of reaching the target have to be judged together. This page cannot give you that chance, but it gives a test. Work out the break-even share for your ratio, then ask whether you can point to a reason other than the ratio itself why price should reach the target more often than that. Count the levels price must cross on the way. If you cannot name a reason, pass.
Entry timing changes the ratio
Using the example, an early entry at 100 with a stop at 96 and a target at 108 is 1:2. Suppose you wait for a confirming close at 103 and the stop stays at 96. Risk is now 7, reward is 5, and the ratio is about 1:0.7. That is because the stop stayed at 96. If the confirming move forms a new level, the stop can go beyond that level instead, which cuts the risk and leaves the cost in reward alone, the trade-off the ending diagonal setup describes. Here, waiting bought confirmation at the price of a wider stop and a smaller reward.
In general, a large reward, a small risk and full confirmation tend to pull against each other, so expect to give up one. Choose by your own tolerance for being wrong early. If price has already run and the ratio no longer works at the price you would get, wait for a pullback or pass.
Costs make the ratio worse
Fees on entry and exit, slippage on the stop and any funding you pay on perpetual futures add to the loss and cut the gain. For arithmetic only, assume round-trip costs of 0.4 per unit in the example. The loss at the stop becomes 4.4, the gain at the target becomes 7.6, and the ratio falls from 2 to about 1.7. The break-even share moves from one in three to about 37%. Check the ratio after costs, not the one drawn on the chart.
Scaled exits
Closing part of the position early changes the blended ratio. In the example, close half at 104, which is 1R, and trail the rest. If the second half is stopped at entry, the whole trade gains 2 per unit against 4 of risk, or 0.5R. If the second half reaches 108, it gains 6 against 4, or 1.5R. Neither is 2R. Measure each part, and measure the ratio at entry, before the stop moves to break-even and changes the risk on what is left.
Default settings
This manual sets no fixed minimum ratio. The ratio filters trades, and the position size comes from the stop.
| Setting | Value | When traders use it |
|---|---|---|
| This manual's default | Measured at entry from a structure stop and a target at a real level, with no fixed minimum | Every trade here. The planned loss stays within 1 to 2% of the account whatever the ratio, a house constraint and not a recommended allocation. Less is allowed. |
| Variation: minimum filter | 1:2 | A commonly cited bar, and this page names no single source for it. Its limitation is that it tempts you to push the target out until the trade passes. |
| Variation: lower ratio | 1:1 to 1:1.5 | Some traders accept it when the target is close and they can name a reason beyond the ratio for expecting price to get there. |
| Variation: scaled exits | Part closed at 1R, the rest trailed | The blended ratio sits between the outcomes. Measure each part. |
How it is used in this manual's setups
Every setup records the entry, stop, targets and ratio before any order goes in. If one is missing, skip the trade. Size comes from the stop, as position sizing shows, and the ratio then asks whether the target pays enough for that stop.
- Ending diagonal breakdown. The page sets out three entries with different trade-offs between confirmation and reward, and warns that chasing the drop after the first leg shrinks the ratio. It writes the figure as reward to risk.
For how a ratio combines with the frequency of wins and losses over many trades, see expectancy and drawdown.
Common mistakes
- Choosing the target to fit the ratio. Put the target at the next real level and accept the ratio that results.
- Taking a poor setup because the ratio is big. Judge the setup first. A large ratio on a weak idea is still a weak trade.
- Chasing after the move. Recalculate with the price you would actually get, and wait or pass if the ratio fails.
- Copying another trader's ratio. A published ratio assumes that setup's entry. If you enter elsewhere, calculate your own from your own prices.
- Ignoring costs. Subtract fees, slippage and funding before deciding whether the trade clears your bar.
What this cannot tell you
The ratio is built from prices you chose, so it cannot say whether price will reach the target or hit the stop first. It cannot say whether the stop is in the right place either: pulling the stop closer raises the ratio and lowers the odds of surviving ordinary swings. A drawn box can show the ratio gross of costs, which overstates what the trade can pay, so check whether your tool nets them out.
Questions
What is a good risk to reward ratio?
No ratio is good on its own. A minimum of 1:2 is a commonly cited bar, but the ratio only means something beside the chance of reaching the target, and that is never known in advance.
Is it written risk first or reward first?
Both appear. 1:2 risk to reward and 2:1 reward to risk describe the same trade. Writing it as 2R avoids the confusion.
Does a better ratio mean I should risk more?
No. The planned loss stays within 1 to 2% of the account, this manual's house constraint, whatever the ratio, and less is always allowed. Use the ratio to decide whether to take the trade, and keep it out of the size.