Definition
Expectancy is the average result per trade, measured in R, where 1R is the planned loss. Drawdown is the fall from the account's highest balance to a later low. Under a fixed planned-loss rule, a run of losses is normal, and the drawdown a given run would cause can be worked out in advance.
Expectancy asks whether the winners pay for the losers; drawdown asks how deep the account falls meanwhile. Use them to decide whether a setup has earned more trades, and whether your planned loss can survive a bad run.
How it works
R is the unit
R is the planned loss on a trade, in cash and with the allowance for costs included. A stop-out at the planned price is a loss of 1R, and a trade that nets twice the planned loss is +2R. Record the realised result, net of costs: R = net result / planned loss. A stop that fills so the loss is 20% larger than planned is a loss of 1.2R. The risk to reward page reads a target in R from chart prices before costs; a journal records it net, so a 2R target on the chart pays less than 2R here.
Expectancy
Write p for the share of trades that win, W for the average win in R and L for the average loss in R. Then expectancy E = p x W - (1 - p) x L.
For arithmetic only, assume p = 0.40, W = 2R and L = 1R. E = 0.4 x 2 - 0.6 x 1 = +0.2R per trade. Break-even is where E is zero, at p = L / (W + L), which is one in three here. Small shifts flip the sign. At p = 0.33, E is about -0.01R, and at p = 0.30 it is -0.1R.
A share of winners alone says nothing. Assume p = 0.70 with W = 0.3R and L = 1R. Then E = 0.7 x 0.3 - 0.3 x 1 = -0.09R: seven winners in ten, and still a loser.
Losing runs are normal
Even with positive E, a long record holds runs of losses. Assume p = 0.40 and independent trades. Five losses starting now has a chance of 0.6 to the fifth power, about 8%. That is the wrong number to watch, because a run can start at any trade. Over 100 trades, the chance of at least one run of five or more losses is about 98%, of eight or more about 49%, and of ten or more about 20%. Independence is an assumption. Losses that cluster, such as related coins stopping out together, can make long runs more common.
Drawdown
Drawdown = (peak balance - current balance) / peak balance. Maximum drawdown is the largest such fall in a record, measured here on the balance of closed trades. When each planned loss is a share of the current balance, losses compound on a shrinking base, so n stop-outs in a row cost a little less than n times the planned loss (assume every stop fills at its planned price).
| Stop-outs in a row | Planned loss 1% | Planned loss 2% |
|---|---|---|
| 5 | 4.9% | 9.6% |
| 10 | 9.6% | 18.3% |
| 20 | 18.2% | 33.2% |
The way back is steeper than the way down. After a fall of d, the balance must rise by d / (1 - d) to recover: a 10% fall needs a rise of about 11.1%, 20% needs 25%, and 50% needs 100%.
Hypothetical walkthrough: six stop-outs and a pause rule
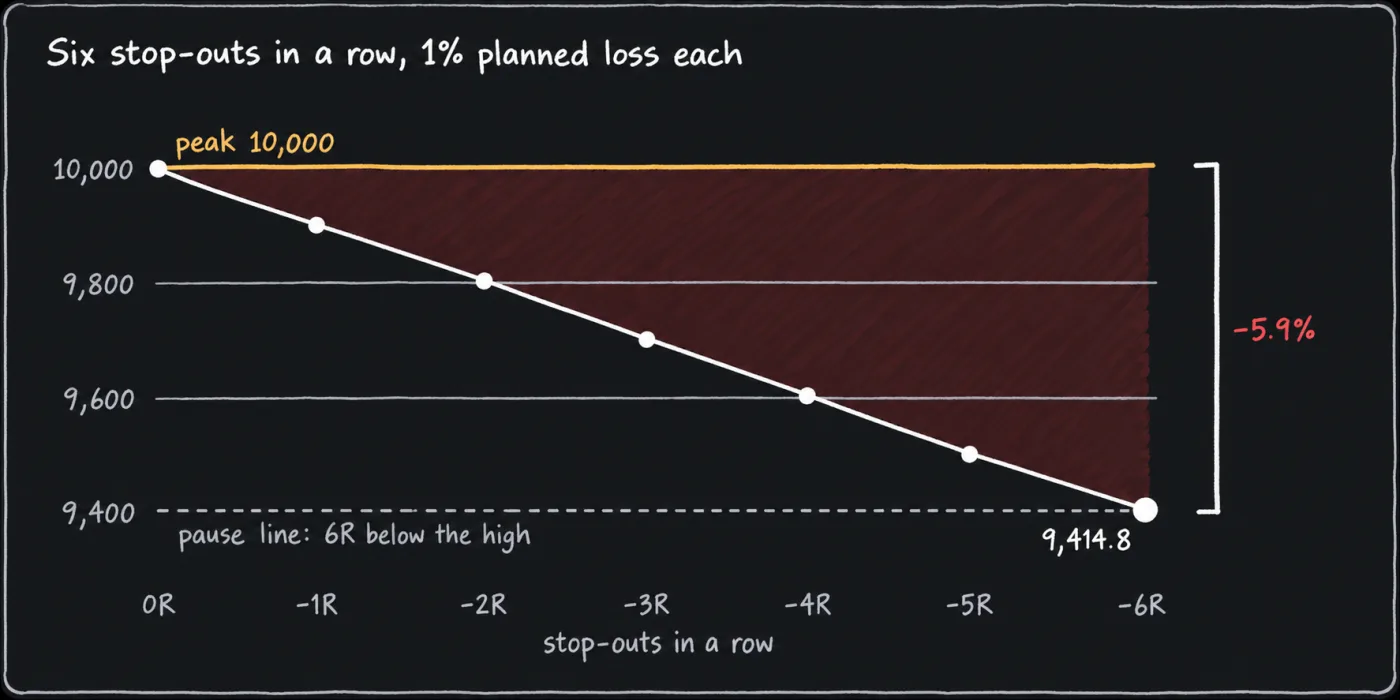
Hypothetical walkthrough. Invented prices and an invented outcome, chosen to teach the decision. Not a recorded trade, and not evidence of how often this setup works.
Assume a reader trades one setup with a planned loss of 1% on a 10,000 account. Before the first trade they wrote a rule: pause and review when cumulative R falls 6R from its high. Their 40-trade journal shows p near 0.40 and W near 2R. Then six trades in a row stop out at the planned price. Cumulative R is down 6R from its high, so the rule fires. In cash, the balance is 10,000 x 0.99 to the sixth power, 9,414.8, a drawdown of 5.9%.
Three questions decide it. Were all six stops honoured at the planned size? The journal answers that. Is the run unusual? From a given start, six losses in a row has a chance of 0.6 to the sixth power, about 4.7%, but over 46 trades a run of six or more has a chance of about 59%, and over 100 about 87%, so the run alone does not show the setup broke. What does it do to the estimate? If the first 40 trades held 16 winners, the record is now 16 in 46, or 0.35, close to the break-even share of 0.33 for 2R wins, with a rough 95% range of about 0.14 either side.
The plan: pause as written and check the six entries for rule breaks (a moved stop, a changed size, an entry outside the setup). If there are none, resume at the same share of the balance or a lower one, or keep testing before resuming. If there are, fix those first. Dropping the setup is also allowed. Raising the planned loss is not. It stops at the plan because the point is the rule, not what the next trade does.
Default settings
This page cites no published default for these process figures, so the table lists the reference values this manual uses. A widely cited 6% rule limits monthly losses; the pause trigger here is this manual's own choice, set in R.
| Item | Value | Status and limitation |
|---|---|---|
| Unit | R, the planned loss; results recorded realised and net of costs | This manual's choice. Mixing planned and realised R hides what slippage costs. |
| Planned loss per trade | 1 to 2% of the current balance | House constraint, a choice and not a recommended allocation. Lower is allowed. It is the loss if the stop fills at its price. |
| Read expectancy after | At least 100 recorded trades | This manual's choice, a floor and not proof. The range is still wide at 100; testing a setup has the arithmetic. |
| Pause trigger | Set in advance as cumulative R below its high; the examples assume 6R | This manual's choice. Too tight pauses on ordinary variance, too loose lets the fall run. |
| Variation: fixed dollar R | The same cash planned loss every trade | Drawdown adds up in a straight line, but the share of the account drifts as the balance changes. Recheck it against 1 to 2%. The main text keeps the share fixed. |
How it is used in this manual's setups
Every setup fixes a stop and a target before entry. The risk to reward page gives the ratio per trade, and position sizing keeps the planned loss the same share of the balance after a loss. The review step of the decision cycle asks whether a plan is worth following, and this page supplies the arithmetic. The trading journal holds the R of every trade and the reason for every pass.
Common mistakes
- Reading expectancy from a handful of trades. A short record is mostly noise. Wait for the floor in the table.
- Mixing planned and realised R. Log what the exit actually cost, including fees and slippage.
- Chasing the share of winners. A high share with small wins can lose, as the 0.70 example shows.
- Raising the planned loss to win a drawdown back. Keep the same share of the balance.
- Logging only the trades you took. Log passes with their reasons, kept apart from the R record, since a pass has no result. Dropping signals that fit the rules after the fact flatters the setup.
What this cannot tell you
- The next trade, or that this expectancy will hold. It averages a past record, and at 30 or 100 trades that sample's range is wide.
- The order results arrive in. Two records with the same expectancy can have very different drawdowns.
- Your largest future drawdown. The table is arithmetic on an assumed run of stop-outs that fill as planned, not a forecast.
Questions
What is a good expectancy?
No figure is good on its own. A value above zero after costs on a record large enough to read is the minimum, and this page names no threshold beyond that.
How many losses in a row are normal?
It depends on the share of winners and the number of trades. With 40% winners, a run of five or more somewhere in 100 trades is very likely, and a run of ten or more shows up about one time in five.
How big a drawdown should I expect?
Work it out from your own planned loss. Ten stop-outs in a row at 1% take the balance down by about 9.6%. If that would make you break the plan, the planned loss is too large for you.