Definition
To test a trading setup, write its rules down, apply them signal by signal to charts you did not build them on, record every signal including the ones you would have skipped, and subtract costs. Then run the same rules on paper or at the smallest size until the record is large enough to read.
A test turns "this looks right" into a record of results in R that someone else could repeat. Use it to decide whether a setup moves to small real trades, stays in testing, or goes back to its rules.
How it works
Write rules that leave no judgement
A test is only as good as the rules it applies. Write the trigger, the invalidation, the stop buffer, the size rule, the exit and the pass conditions as the decision cycle lays them out. The check: could someone else apply them to the same chart and get the same signals? A setup that rests on a wave count can fail this check, because two people can mark the same chart differently. Testing it measures you and the rules together, so mark the count before you look at what followed.
Keep some charts back
Build the rules on one set of charts, then test them on charts you have not looked at: later months, or other coins. If you change a rule after seeing the held-back charts, they are no longer held back.
Trying many settings on the same data is how a rule fits the past by luck. For arithmetic only, assume each setting combination has a 5% chance of looking good by chance and the tries are independent. Try 20 combinations and the chance at least one looks good is 1 - 0.95 to the 20th power, about 64%. Real combinations are not independent, so the figure differs, but trying more settings still raises the chance. Count how many variants you tried.
Replay without looking ahead
Hide the right side of the chart, or use a replay mode in your charting tool, and move one candle at a time. Four rules keep the test honest:
- Act only on a candle that has closed. A rule that needs a close can enter at the next candle's open or later, never at the close it just read.
- Record a wave count or level as it stood then, not as you would draw it now.
- If one candle touches both the stop and the target, count the stop.
- Take every signal the rules give, and record any you skip apart from the results. Dropping the ugly ones tests your selection, not the setup.
Net out costs
Subtract fees, slippage and expected funding from every result, as trading costs and liquidity shows. Paper fills tend to be optimistic: many simulators fill at the quoted price with no queue and no slippage. Log each trade in the columns of your live trading journal, as R, so test and live records read alike.
Count enough trades
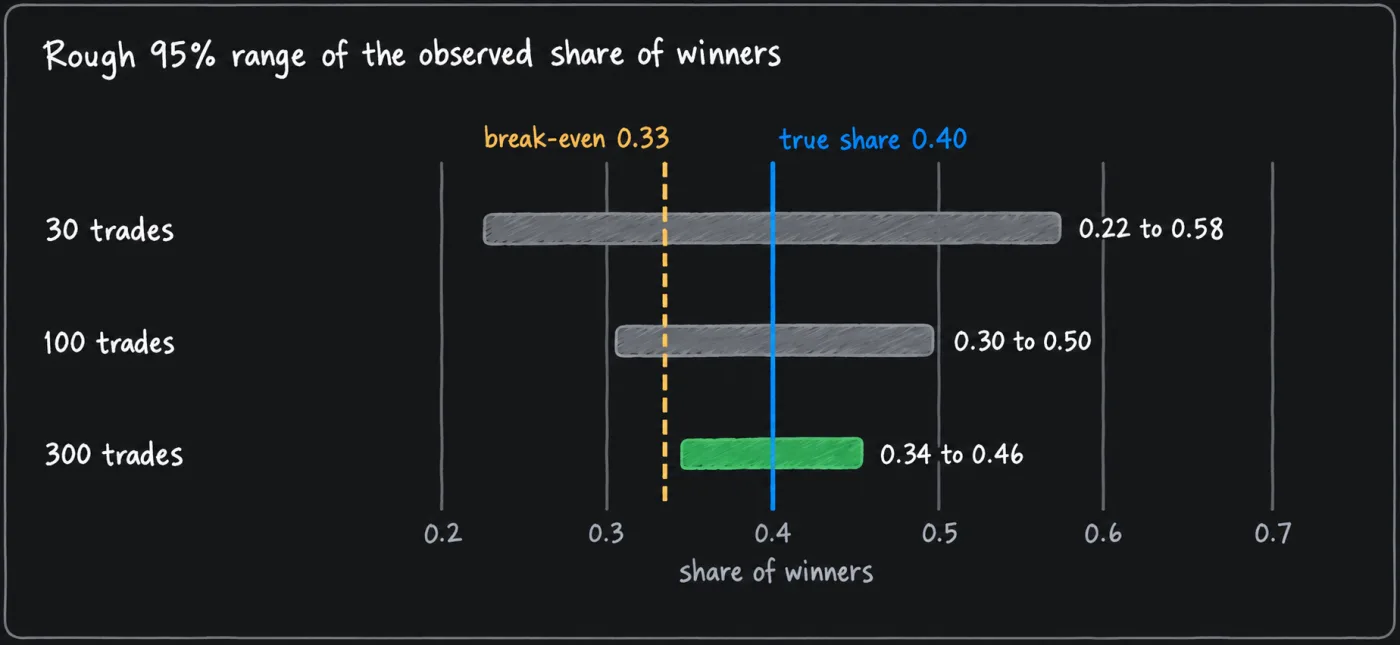
If trades were independent with a true share of winners p, the share you observe on n trades would scatter around p with a standard error of about the square root of p x (1 - p) / n, so a rough 95% range is 1.96 times that either side. Assume the true share is 0.40. The table shows how far a sample can sit from the truth. It is not an interval computed from your own record.
| Trades | Rough 95% range for the observed share if the true share is 0.40 |
|---|---|
| 30 | 0.22 to 0.58 |
| 100 | 0.30 to 0.50 |
| 300 | 0.34 to 0.46 |
For wins of 2R against losses of 1R, break-even is a share of 0.33. At 30 trades and at 100 the range still covers it, so a profitable setup and a flat one can look alike; at 300 it clears it, as an illustration and not a guarantee. When wins differ in size, expectancy carries more uncertainty than the share of winners alone. The normal approximation is rough at small counts, and the point holds.
Then forward test
A test on past charts carries your hindsight, because you can see what price did next when you mark levels. Run the rules forward on live prices before committing size: on paper first. If the criteria are met and the smallest size the exchange allows fits your planned loss, a small real trade then shows real fills. Staying on paper, or taking no position, is also allowed. Set the pass criteria before you start, such as a minimum count, expectancy above zero after costs, and a drawdown inside your pause trigger. A criterion fixed after seeing the result is a description of the result. Review and practice covers how a changed rule gets tested before you adopt it.
Default settings
This page cites no published default for a testing process, so the table lists the reference values this manual uses.
| Item | Value | Status and limitation |
|---|---|---|
| Data split | Build on older charts, hold back newer ones | This manual's choice. Time order keeps the future out of the build. One regime may not look like the next. |
| Minimum count before reading | At least 100 signals taken and recorded in R | This manual's choice, a floor and not proof. The table above shows the range is still wide. |
| Entry fill | Open of the candle after the signal | This manual's choice. In a fast breakout the real fill can still be worse than that open. |
| Same-candle stop and target | Count the stop | This manual's choice. It understates a setup that really did hit the target first. |
| Pass criteria | Written before the test | This manual's choice. Without it the bar moves to fit the result. |
How it is used in this manual's setups
Every setup in this manual is a plan to be tested, not a result. Before sizing up a setup such as the ending diagonal breakdown, apply these steps to it, remembering that its wave count is a judgement. This manual cites no test of any setup on this site. The record you build also feeds the review step of the decision cycle.
Common mistakes
- Tuning on all the data. Keep charts back, and stop changing rules once you look at them.
- Skipping signals that look bad. Take them all, or the result reflects your eye.
- Filling at the signal candle's close. The close is only known after it prints. Use the next open.
- Testing a handful of trades. Use the table: a short record shows noise.
- Ignoring costs. A gross result can turn negative after fees, slippage and funding.
- Moving the pass criteria. Write them first and keep them.
What this cannot tell you
- That the setup works now. A past test covers the market that existed then. A later market can behave differently.
- How you will act on a losing run. A historical or paper test has no money in it, so it cannot show whether you keep the rules when a drawdown arrives.
- Which coins you could not test. Charts of coins that were delisted are hard to find, so a test on surviving coins can look better than the full set would.
- Your real fills. Past candles do not show what resting orders were available to you.
Questions
How many trades do I need to test a setup?
At least 100 signals taken and recorded before you read the result, and more to separate a small edge from none. The table shows why: at 100 trades the observed share of winners could sit well away from the true one.
Is paper trading enough?
It tests the rules going forward, which a past-chart test cannot. It does not test fills or your behaviour with money at risk. If the criteria are met and the smallest real size fits your planned loss, that is the next step. Not trading is also allowed.
Can I test on any chart?
Only on charts you did not use to build the rules, and only if you move one closed candle at a time. A chart you have already studied has been tested by your memory.