Definition
A crypto futures trade pays four costs: trading fees, the spread between best bid and ask, slippage when an order fills away from the price you expected, and funding on perpetual contracts, which can also be received. The ordinary part of them makes the loss at the stop bigger and the gain at the target smaller, so it belongs in the distance you size from.
Liquidity is how much you can trade near the quoted price before your own order moves it. Thin liquidity tends to widen the spread and deepen the slippage. Use these costs to decide whether a trade is still worth taking once they are paid, and how much room to add to the stop distance.
How it works
Fees
Exchanges charge a fee on position value, not on margin, at every fill: the entry and the exit, including a stop that triggers. A maker order rests on the order book and may fill later, or never. A taker order fills at once against resting orders, and takers usually pay the higher rate. Rates depend on the exchange and your volume tier; this page cites no schedule, so read the fee page. A stop-market fills at once, so on many exchanges it pays the taker rate.
For arithmetic only, assume a taker fee of 0.06% of position value. On a position worth three times its margin, one fill costs 0.18% of the margin and a round trip 0.36%.
Spread and slippage
The spread is the gap between the best bid and the best ask. A market buy pays the ask and a market sell receives the bid, so a round trip at market gives up the whole spread across its two fills.
Slippage is the gap between the price you expected and the price you got. Measure it against the best price when you decided, and count the spread once. It has two causes. A market order larger than what rests at the best price walks the book, filling the rest at worse prices. Or price moves between your decision and the fill, which is what a stop-market suffers in a fast move.
For arithmetic only, assume you buy 10 units at market into two different books.
| Book | Asks resting | Average fill | Above the best ask |
|---|---|---|---|
| Deep | 4 at 100.00, 3 at 100.10, 3 at 100.30 | 100.12 | 0.12% |
| Thin | 2 at 100.00, 3 at 100.40, 5 at 101.00 | 100.62 | 0.62% |
The order is the same and the cost is about five times larger. A stop sells into whatever is resting when it triggers.
Funding
On perpetual futures, longs and shorts exchange a funding payment at set intervals, commonly every 8 hours, though the interval depends on the exchange and contract, so check the contract page. It is charged on position value. You pay when the rate points against your side and receive when it points your way, and the rate changes from one interval to the next. Funding rates covers who pays whom and what extreme rates say.
For arithmetic only, assume you pay a constant 0.01% per interval on a position that stays worth 5,000: 0.50 per payment, 4.50 over three days (nine payments). Funding grows with the time you hold.
Liquidity
Thin liquidity is why the same order costs more on one coin than another. Fewer units rest near the price, so the spread is wider and an order walks further. Volume shows what traded, not what is resting now, so compare the order book depth near the price with your order size. This page names no minimum daily volume, because the right one depends on your order size. The movers tool lists coins by volume; the contract page's order book is the manual route.
Putting costs into the stop and the size
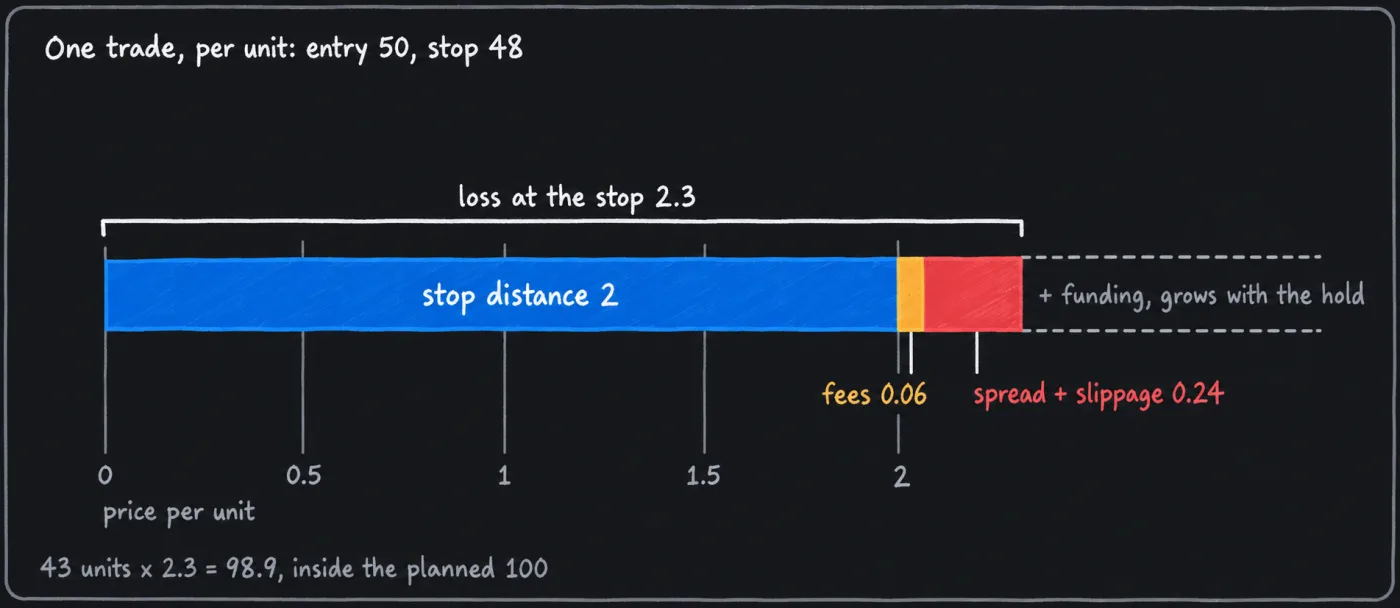
Take the position sizing example: a 10,000 account, a planned loss of 100, an entry of 50 and a stop at 48, a distance of 2. Assume round-trip costs of 0.3 per unit: about 0.06 in fees, the rest slippage and spread across the entry and the stop fill. Add that to the distance you size from, and leave the stop where the chart puts it: units = 100 / (2 + 0.3), about 43.5, which rounds down to 43. The planned loss with costs is 43 x 2.3 = 98.9.
The same 0.3 comes off the reward. With a target at 54, the gross reward is 4 against a loss of 2, a ratio of 2. After costs it is 3.7 against 2.3, about 1.6. If every trade ends at the full stop or the full target, the share that must reach the target to break even rises from one in three to about 38%. The risk to reward page covers the ratio itself.
Costs are close to a fixed amount per unit, so they take a bigger share of a tighter stop. At a stop 2 away, 0.3 is 13% of the planned loss (0.3 / 2.3). At a stop 0.5 away it is 37.5% (0.3 / 0.8). On the tighter trade, costs take over a third of the loss budget. These sums use ordinary fills. In a fast market a stop-market can fill further away, and the realised loss exceeds the planned loss.
Default settings
This page cites no published default for a cost allowance, so the table lists the reference values this manual uses.
| Item | Value | Status and limitation |
|---|---|---|
| Costs counted | Fees and spread and slippage on both fills, plus funding for the planned hold | This manual's choice. Leaving one out makes a short trade look cheaper than it is. |
| Allowance in the stop distance | Measured from your fee tier and recent fills; the examples assume 0.3 per unit | Illustrative assumption, not a typical figure. Yours differs by exchange, coin and order size. |
| Pass condition | Costs above one fifth of the planned loss | This manual's choice. A lower bar rejects more trades, and a higher one lets costs use more of the loss budget. |
| Entry order | Limit when a missed fill is acceptable, market when getting in matters more | Convention. Order types covers both. |
How it is used in this manual's setups
Costs enter at the risk budget step of the decision cycle: the stop distance used for sizing includes the allowance, and a trade whose costs exceed one fifth of the planned loss is a pass. The ending diagonal breakdown sizes its short from the stop above the wave 5 high, so the allowance goes on that distance. A trade held for days adds expected funding; perpetual futures explains the contract.
Common mistakes
- Reading the fee as a share of margin. It is charged on position value, so work it out on the full value.
- Costing only the entry. Every fill pays, including the stop and the target.
- Judging liquidity by daily volume alone. Compare your order size with the depth near the price.
- Forgetting funding on a hold. Add the expected payments for the planned hold to the allowance.
- Taking a stop so tight that costs decide the trade. Check costs as a share of the planned loss before you size.
What this cannot tell you
- The fill you will get. The book you see can change before your order arrives, and a stop triggers into whatever is resting at that moment, often in a fast market.
- Whether the target is reachable. Costs fix what a target pays after fees and slippage. They say nothing about whether price gets there.
- Your fee rate or next week's funding. Fee tiers differ by exchange and volume, and funding resets at each interval.
- The cost of a gap through the stop. An allowance sized from ordinary fills does not cover it.
Questions
What are the trading costs on crypto futures?
Fees on every fill, charged on position value; the spread; slippage; and funding on perpetuals. Fees and funding are published, and the contract page shows the current funding rate. Spread and slippage depend on the order book when you trade.
How much does slippage cost on a crypto trade?
It depends on your order size against the depth near the price. The same 10 units cost 0.12% over the best ask in the deep book above, 0.62% in the thin one.
Are limit orders cheaper than market orders?
Per fill, often: a resting order tends to pay the lower maker fee and avoids crossing the spread, though fee schedules differ. The cost is that it may not fill, and a trade you miss is a decision, not a saving.