Definition
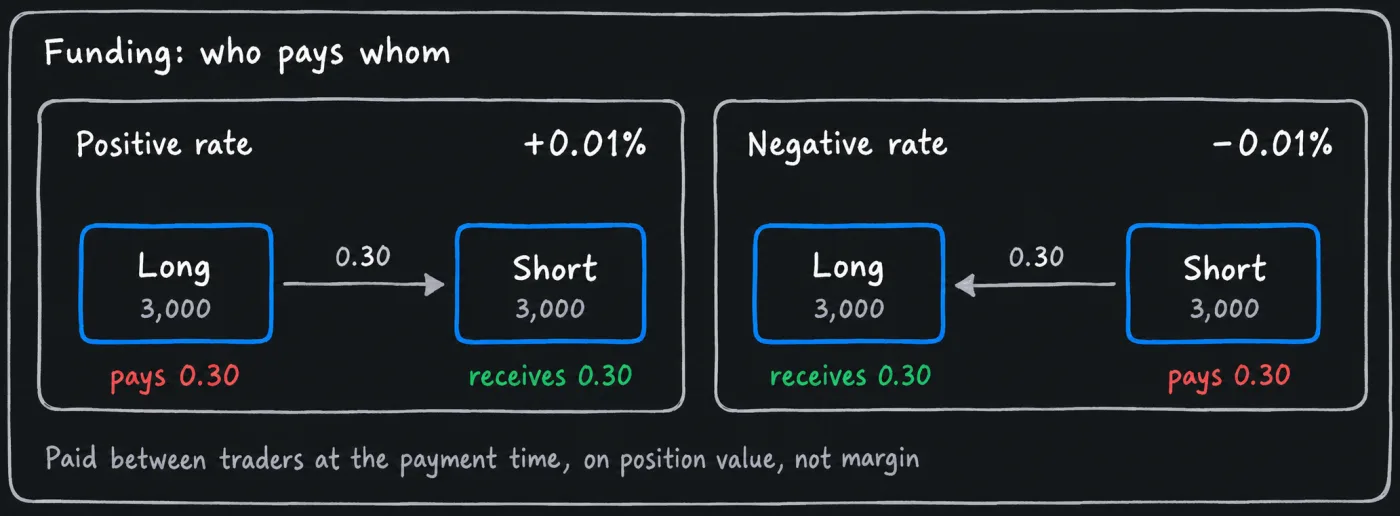
The funding rate is the percentage that longs and shorts on a perpetual future pay each other at set intervals, charged on the full position value. When the rate is positive, longs pay shorts. When it is negative, shorts pay longs. It exists to keep the perpetual's price close to the spot price.
The rate makes holding one side cheaper or dearer, and a rate far from its usual level shows that one side is paying heavily to stay. It does not say where price goes next. Use it to decide what holding a position will cost or earn, and whether a crowded rate is a reason to size down or pass.
How it works
Who pays whom
The payment is the position value times the rate, exchanged between traders. On most exchanges the exchange does not keep it, and funding is settled at fixed payment times: only a position still open at the payment time pays or receives, and one fully closed before it pays nothing and receives nothing. A close order still resting is not a closed position, so check the time. Some venues calculate funding continuously and settle it at intervals, so a position pays or receives for the time it was open. The contract page says which method applies.
For arithmetic only, assume a rate of +0.01% on a position worth 3,000. A long pays 0.30 and a short receives 0.30. If the rate is -0.01%, the short pays and the long receives. The charge is on position value, not on margin. With margin of 1,000 behind that 3,000 position, 0.30 is 0.03% of the margin for one payment.
How the rate is set
Exchanges publish their own formulas, and many build the rate from two parts: an interest component, often a fixed baseline of about 0.03% a day, which is 0.01% per 8-hour interval on many major contracts and proportionally less per payment on a shorter interval, and a premium that follows the gap between the perpetual's price and the index price, often averaged over a window, so the rate lags the current gap. When the contract has traded above the index, the premium pushes the rate up, and when below, down. Exchanges also set a cap and a floor, which differ by contract and can change. The figure shown before a payment is usually an estimate that can move until the payment time.
How often it is paid
Commonly every 8 hours, three payments a day, which at 0.01% adds up to 0.03% of position value a day. Some exchanges and contracts use 4 hours or shorter, so read the interval on the contract page.
What it costs over a hold
Funding grows with time and position value, and the rate changes each interval. The trading costs page assumes a constant 0.01% on a position worth 5,000: 0.50 per payment and 4.50 over three days, nine payments. Against a planned loss of 100, that is 4.5%, a small share of it.
Now assume your side pays 0.10% per interval, ten times as high, on the same 5,000 position with its stop 2% from entry. Nine payments cost 45, which is 45% of the planned loss of 100 and more than twice the one fifth this manual allows, before fees and slippage. A smaller position does not help, because funding and the planned loss shrink together. With the stop where the chart puts it, the choices are a shorter planned hold or a pass, so the rate itself can be the reason not to take the trade.
What an extreme rate says
A rate far above its baseline usually means the contract has been trading well above the index and longs are paying heavily to hold. A rate far below means shorts are paying. That is positioning information: it shows which side is paying to hold on this contract, on this exchange, and hints that the side is crowded. It does not count traders or measure their leverage.
It does not show direction. A crowded side can be squeezed, when the price move against it forces liquidations that feed the move. The same side can also keep paying for days while the trend runs, because the rate reflects the trend that already happened. This page cites no test of extreme funding against later price on perpetuals. Treat a stretched rate as a reason to ask what holding costs and how crowded the trade may be. It is not an entry signal, or a reason to take the other side.
Payment times and the collect-the-payment trade
Some traders open a position to collect a negative rate, then close after the payment, and price can behave oddly around payment times on coins with extreme rates. This page cites no measurement of how reliable that is. The sum shows the trap. Assume a rate of -0.05% on a 3,000 long: the payment received is 1.50, and a 1% move against the position is a loss of 30, twenty times the payment.
Default settings
This page cites no published default for using funding, so the table lists this manual's reference values and common exchange figures.
| Item | Value | Status and limitation |
|---|---|---|
| Payment interval | Commonly every 8 hours | Convention. Varies by exchange and contract, so read the contract page. |
| Baseline rate | Commonly 0.01% per 8-hour interval, about 0.03% a day, on major contracts | Convention, not a rule. Shorter intervals commonly scale it down per payment. Exchanges set their own formulas, caps and floors. |
| Charged on | Full position value | Defined. Not on margin. |
| Funding in the cost allowance | Expected payments for the planned hold, at the current rate | This manual's choice. The rate changes each interval, so recheck on a long hold. |
| Pass condition | Costs, funding included, above one fifth of the planned loss | This manual's choice. A lower bar rejects more trades, and a higher one lets costs use more of the loss budget. |
| Where to read it | The contract page and its funding history | Manual route. The funding scanner lists current rates across contracts. |
How it is used in this manual's setups
Funding enters at the risk budget step of the decision cycle: the expected payments for the planned hold go into the cost allowance, and a hold whose total costs pass one fifth of the planned loss is a pass. Check the contract's funding history before putting a coin on the shortlist. A long after a fall, such as the oversold bounce long, is where a negative rate can show up, because shorts are paying to hold. A short held across payments receives while the rate is positive and pays when it turns. The perpetual futures page explains the contract.
Common mistakes
- Reading funding as a fee the exchange keeps. On most exchanges it moves between traders.
- Costing it on margin. It is charged on position value.
- Treating a high rate as a signal to take the other side. Crowding is not a trigger.
- Using this week's rate for a long hold. The rate changes every interval, so recompute the allowance and check the payment times.
- Counting a payment received as profit. It is small next to a move against the position.
What this cannot tell you
- Where price goes. A rate shows who is paying, not who will be right.
- How long a rate will last. The figure shown can move until the timestamp, and extreme rates have no fixed lifespan.
- How crowded the market is. The rate reflects one contract on one exchange and counts no traders, and this page cites no comparison across venues.
- The exact payment on your account. Caps, floors, intervals and margin treatment differ by exchange and contract.
Questions
Is a high funding rate bullish or bearish?
Neither on its own. A high positive rate says longs are paying heavily to hold. This page cites no test showing that it predicts the next move, and a trend can hold such a rate for days.
What is a normal funding rate?
On many major contracts the baseline is 0.01% per 8-hour interval, about 0.03% a day, and a contract with a shorter interval commonly pays a proportionally smaller baseline at each payment. Exchanges set their own formulas and caps, so the contract page and its funding history show what is normal there.
Do I pay funding if I close before the payment time?
On exchanges that settle at fixed payment times, no, if the position is fully closed before it. Some venues calculate funding for every moment a position is open, so closing early only shortens the charge. Check the contract page, because the method and the interval vary.