Definition
Supertrend is a public trailing-line indicator. It plots a line a multiple of ATR below the midpoint of recent candles in an uptrend and above it in a downtrend, and it flips sides when a candle closes through the line. The common charting default is an ATR length of 10 and a multiplier of 3, and platforms and traders vary both.
It answers one question: has a candle closed through the line that trails the recent midpoints by a multiple of ATR? Use it to decide where a trailing stop sits and whether a close has crossed it, not to predict where price goes.
How it works
Each candle gives a midpoint, (high + low) / 2. The indicator builds two basic bands from it:
- Basic lower band: midpoint minus multiplier x ATR(length).
- Basic upper band: midpoint plus multiplier x ATR(length).
The ATR is the average true range, usually Wilder-smoothed (see the ATR page). The line then uses final bands, which add the ratchet:
- Final lower band: if the previous close is above the previous final lower band, take the higher of the basic lower band and the previous final lower band. Otherwise take the basic lower band.
- Final upper band: if the previous close is below the previous final upper band, take the lower of the basic upper band and the previous final upper band. Otherwise take the basic upper band.
In an uptrend the line is the final lower band. A close below the previous final lower band flips the trend to down, and the line becomes the final upper band. In a downtrend, a close above the previous final upper band flips it back. Scripts differ on whether the close is compared with the previous candle's final band or the current one. In the table below both give the same flip. This is the common charting implementation, and details such as the first candle's seed vary by platform. Credit for the indicator is commonly given to Olivier Seban.
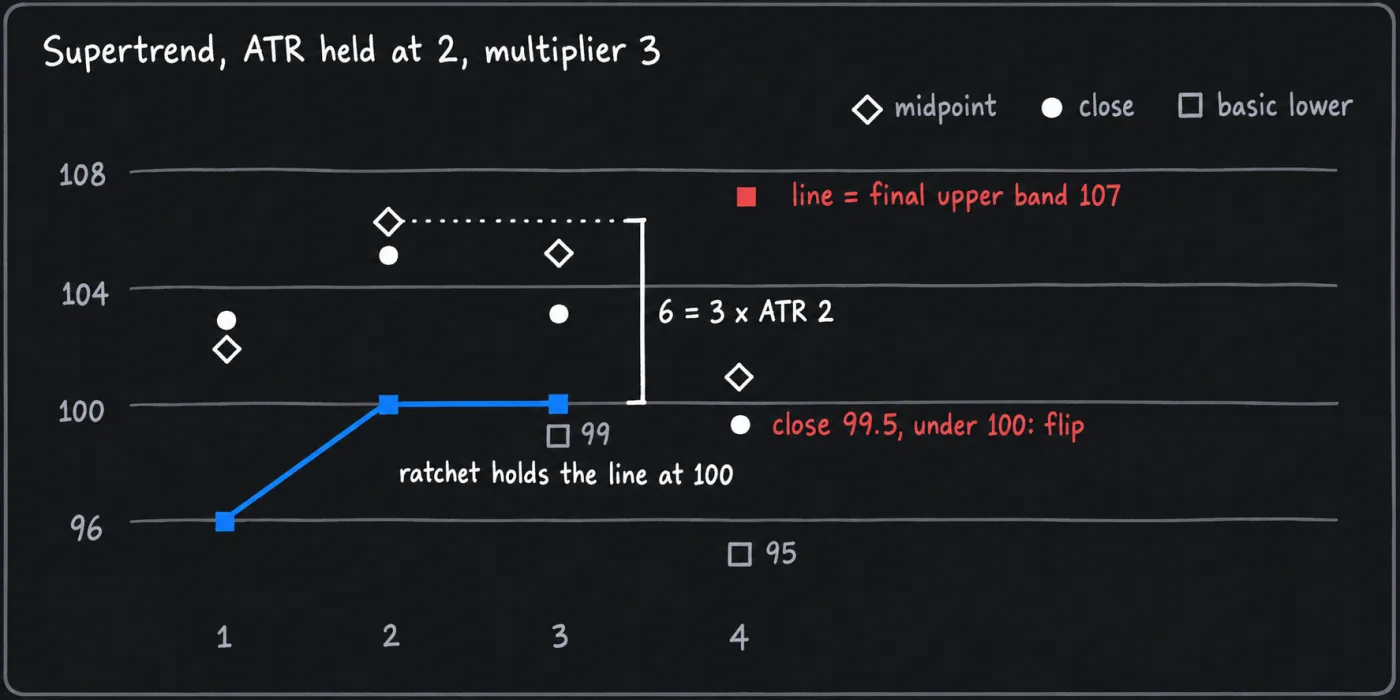
A short run with assumed numbers, for arithmetic only. ATR(10) is held at 2 and the multiplier is 3, so each band sits 6 from the midpoint. A real ATR would move with each candle's range, and these prices are not built to match it. The first candle seeds both final bands from its basic bands.
| Candle | Midpoint | Close | Basic lower | Final lower | Basic upper | Final upper |
|---|---|---|---|---|---|---|
| 1 | 102 | 103 | 96 | 96 | 108 | 108 |
| 2 | 106 | 105 | 100 | 100 | 112 | 108 |
| 3 | 105 | 103 | 99 | 100 | 111 | 108 |
| 4 | 101 | 99.5 | 95 | 100 | 107 | 107 |
On candle 2 the previous close, 103, was above the final lower band of 96, so the line rose to 100. On candle 3 the basic lower band of 99 was below 100, so the ratchet held the line at 100. On candle 4 the close of 99.5 was below the previous final lower band of 100, so the trend flips to down and the line becomes the final upper band, 107.
The line stayed at 100 while the highest midpoint was 106, so it trailed that midpoint by 6, the multiplier times the assumed ATR. Any close below 100 would have flipped it. That is why the indicator flips late: it waits for a close beyond a line that trails the recent midpoints by a multiple of ATR. With a changing ATR the retained line comes from whichever earlier candle set it, so the gap is not always a clean multiple. Part of the move is gone before the flip tells you.
The live candle's values can change until it closes, and a flip can appear and disappear intrabar. Closed candles are fixed.
Settings
A multiplier near 1 puts the line where ordinary candles reach it, so it flips often. A multiplier of 5 or more sits so far away that a large part of a move is handed back before the flip. A shorter ATR length makes the line react sooner to a change in volatility and gives a noisier line, and a longer one does the reverse.
Default settings
| Setting | ATR length | Multiplier | When traders use it |
|---|---|---|---|
| Common charting default | 10 | 3 | TradingView's built-in default, and widely copied. The source is the candle midpoint. |
| Variation: smaller multiplier | 10 | 2 | The line sits closer and flips more often, including on ordinary pullbacks. |
| Variation: larger multiplier | 10 | 4 | The line sits further away and flips less often, handing back more of a move first. |
| Variation: longer ATR | 14 or more | 3 | A steadier line that adjusts more slowly to a change in volatility. |
Platforms vary the ATR smoothing method as well. Check what yours uses, and keep one choice if you compare readings.
How it is used in this manual's setups
This manual's trailing exit is the Chandelier Exit, covered with its own published default of 22 and 3. Supertrend is a public alternative you may see on charts, and no setup here requires it. The two share the idea, a trailing line a multiple of ATR away from recent prices. They differ in the anchor and the default length. Supertrend builds its bands from each candle's midpoint and relies on the ratchet to keep the line from retreating. The Chandelier Exit builds its line from the highest high or lowest low of its lookback, and most scripts ratchet it too. Supertrend commonly defaults to an ATR length of 10 against 22, with the same multiplier of 3.
For the same ATR and multiplier, a highest-high candidate is never below a midpoint candidate, since a high is at least the midpoint. Different histories, resets and ATR lengths mean this page makes no general claim about which line sits closer in practice, and it cites no test comparing the two. The ending diagonal breakdown says to pick one trailing method and use it long enough to judge it. A trader who prefers Supertrend would attach it the same way: switch to it once it moves past the first stop in your favour.
As with the Chandelier Exit, the first stop still comes from structure, and the size comes from that first stop, as stop-loss placement explains. A trailing line that later moves does not resize the position. A flip is judged on a close, so acting on it is a decision after the candle closes. A resting stop order placed at the line is a different rule, and the line moves each candle.
Common mistakes
- Treating a flip as an entry. A flip shows the line was crossed. Use it as one reason beside structure.
- Using it in a range. The line flips on every swing. Skip charts that go sideways.
- Tightening the multiplier to lock in profit. A tighter line is reached by ordinary pullbacks and can exit during one.
- Trusting the live candle. Wait for the close or a flip can disappear.
- Using the default on every coin. A thin or jumpy coin may need a wider multiplier, and a setting fitted to the last move may not fit the next.
- Ignoring the stop distance. The line can sit far from price. Size the first stop from structure, and check that the distance to the line is a loss you accept.
What this cannot tell you
Supertrend cannot tell you where the trend is going. It flips only after a close through a line that trails the recent midpoints by a multiple of ATR, so the flip comes after part of the move has gone, and in a range it flips repeatedly. It cannot say what multiplier suits a coin, because a setting fitted to past candles may not fit the next ones. And it cannot fix the exit price: a close beyond the line is the plan's exit instruction, and the fill can be worse than the line in a fast market.
Questions
What are the best Supertrend settings for crypto?
No setting is best. The common default is an ATR length of 10 and a multiplier of 3. A smaller multiplier flips more often and a larger one gives back more of a move before flipping. Fix one in the plan and keep it across the charts you compare.
Is Supertrend better than the Chandelier Exit?
This page cites no comparison. They are close cousins: both trail price by a multiple of ATR. They differ in the anchor and the common default length. Pick one, write its settings into the plan and judge it over many trades.