Definition
A moving average is an average of closing prices, recomputed on every candle, so it draws a smoother line than price. A simple moving average (SMA) averages the last n closes with equal weight. An exponential moving average (EMA) weights every earlier close, recent ones most, with a smoothing factor of 2 / (n + 1). No default length is published, and platforms vary.
It describes where price has been on average and not where it is going. Use it to decide whether price is above or below a reference line you chose, and whether a plan's condition on that line is met.
How it works
Simple average
SMA(n) is the sum of the last n closes divided by n. Each close carries a weight of 1 / n, so for n = 55 each carries about 1.8%. A close leaves the average all at once when it ages out, which can make the line step even if price does nothing.
Exponential average
The EMA starts from the previous EMA and moves part of the way toward the newest close:
EMA now = alpha x close + (1 minus alpha) x previous EMA, where alpha = 2 / (n + 1).
For arithmetic only, take n = 9, so alpha is 0.2. Assume the previous EMA is 100 and the close is 110. The new EMA is 0.2 x 110 + 0.8 x 100 = 102. The line moved 2 of the 10-point gap.
For n = 55, alpha is 2 / 56, about 0.036. The newest close carries 3.6% against 1.8% for a 55-candle SMA, close to twice the weight. Older closes decay by a factor of 1 minus alpha each candle and never drop to zero. For ordinary lengths, about 86% of an EMA's total weight sits on its last n closes, and the rest is a long tail. For n = 55 the figure is 1 minus (27/28) to the 55th power, 86.5%. Platforms seed the first value differently, as a simple average or as the first close, and the effect fades as candles are added. Give the line some history before you read it.
Lag
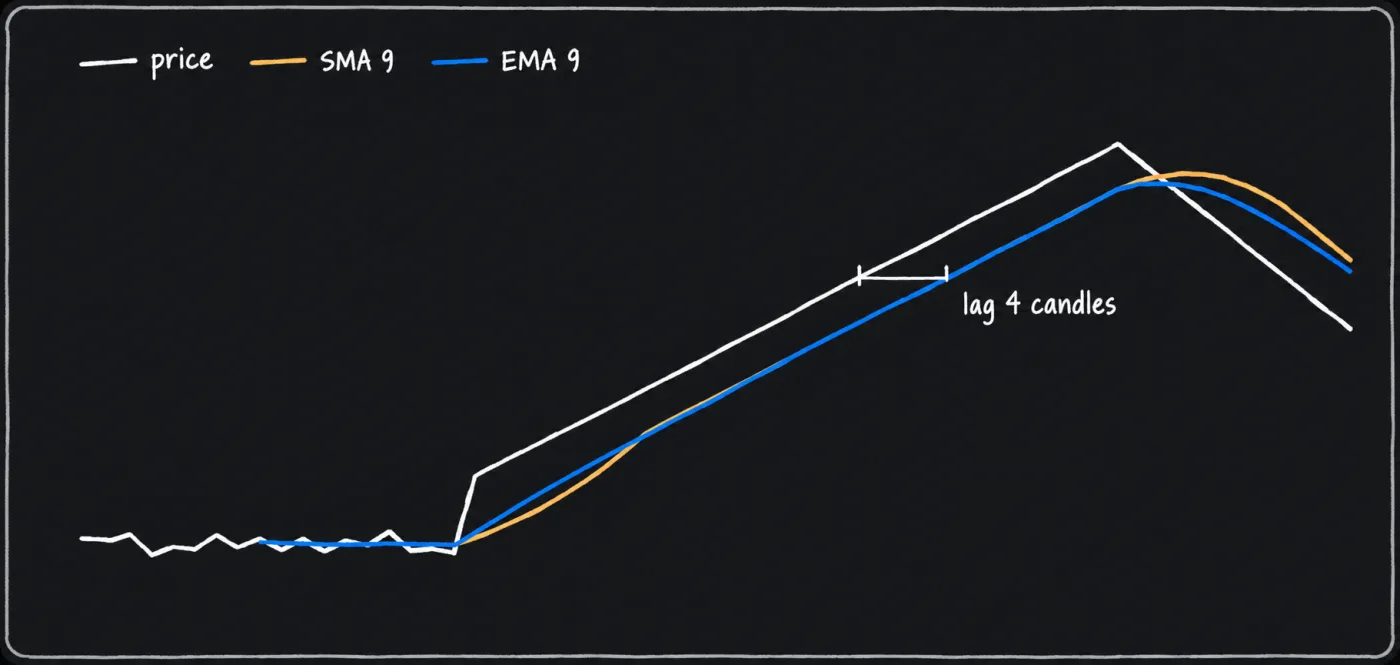
Both averages lag price. When price climbs by a constant amount each candle and startup effects have faded, an SMA of length n sits behind price by about (n minus 1) / 2 candles, and an EMA with alpha = 2 / (n + 1) sits behind it by the same amount. For n = 55 that is 27 candles, or 108 hours on a 4-hour chart, about 4.5 days. That is a statement about a steady ramp, not about reversals or crossovers. The EMA moves more on the newest candle, so it responds sooner to a sudden jump, but in a steady trend it is no closer. Wilder's smoothing, which ATR and RSI use, has the same alpha as an EMA of a longer length: a Wilder average over 14 candles uses 1 / 14, which is 2 / 28, so it matches an EMA of length 27 once both start from the same seed.
Reading it
Two uses are common. The first is as a filter: price above a rising line, or below a falling one, as one condition in a plan. Define "rising" in the plan, for example the line above its own value a set number of candles ago. The second is as a reference level, where a close through the line is read like a close through resistance (see breakouts and retests). One common explanation is that many traders chart the same lengths, so attention gathers at these lines. This page cites no test of that, or that price behaves differently at them than elsewhere.
A crossover of a fast and a slow EMA is the same event as the MACD line crossing zero for those two lengths, so it lags by the same amount. In a range the lines sit close together and cross often.
Default settings
| Setting | Length | When traders use it |
|---|---|---|
| Published definition | Any length n, closing price, alpha = 2 / (n + 1) for the EMA | No default length is published. Charting platforms ship their own, so check yours. |
| This manual's choice: 55 EMA | 55 | The medium reference line. A setup page uses it (see below). Nothing about 55 is special: it happens to be a Fibonacci number, which is no evidence it works better than 50 or 60. |
| This manual's choice: 20 EMA | 20 | A short reference line. |
| This manual's choice: 200 EMA | 200 | Wider context. On a 4-hour chart, 200 candles is about 33 days. |
| Variation: SMA | 50 and 200 are commonly plotted | A crossover of the two is a common chart convention. It lags more than a shorter pair. |
The trade-off with length is lag against noise. A short average hugs price and crosses it often. A long one crosses rarely and is slow to turn. No length is best, and one chosen after a move may not suit the next.
How it is used in this manual's setups
The EMA 55 resistance break long requires a close through a resistance level and the 55 EMA together. The 55 is the length that setup is written around. This page cites no test that 55 works better there than a nearby length. The 20 and 200 serve as context lines on a chart. A line that sits on a level the chart already had (see support and resistance) is easier to defend than one used alone.
A moving average also answers a timeframe question: price above the 55 EMA on the 4-hour chart and below it on the 15-minute chart is two readings. Multi-timeframe analysis says which one to weigh. The MACD page builds an oscillator from two EMAs.
Common mistakes
- Reading a line as support or resistance by itself. Combine it with a level the chart already shows, or leave it as a filter.
- Comparing lengths across timeframes. A length of 55 counts 55 hours on a 1-hour chart and 220 hours on a 4-hour chart. Fix both in the plan.
- Trading every crossover. In a range a crossover repeats. Skip charts where the lines tangle.
- Switching lengths after a miss. A length picked after the move is fitted to it.
- Expecting an EMA to lag less in a trend. It responds faster to a jump, not a smaller lag in a steady trend.
- Using the live candle. The value changes until the candle closes, so read the last closed candle.
What this cannot tell you
A moving average cannot tell you what price does next. It is an average of closes that have already printed. In a steady trend it lags by about half its length, so a close through a long average comes after the move that bent the line. It cannot say which length is right, because the number of candles that suits one coin and timeframe need not suit another. And in a range it gives crossovers that go nowhere.
Questions
What is the best moving average setting for crypto?
No setting is best. The EMA formula is published, but length is a choice. This manual uses the 55 EMA because a setup page does, with the 20 and 200 as context, and says plainly that 55 is not special.
What is the difference between an SMA and an EMA?
An SMA weights the last n closes equally. An EMA weights recent closes more, with a smoothing factor of 2 / (n + 1), so it responds sooner to a sudden move. In a steady trend both lag by about the same number of candles.
Does the EMA smoothing factor change with timeframe?
No. It depends only on n, the number of candles. The same n covers a different span of time on a 1-hour and a 4-hour chart.