Definition
Elliott Wave is a way of labelling a chart. A move with the trend is read as five waves, numbered 1 to 5, and the move against it as three, lettered A, B and C. A count is one trader's reading of which wave price is in now.
This is an optional, discretionary approach, and two careful traders can count the same chart differently. Plenty of traders never count waves and work from levels and swing structure alone. Use a count to decide whether an idea, such as "this move is in its last leg", fits a structure you can label, and at what price the label stops fitting.
How it works
The impulse and the correction
An impulse has five waves. Waves 1, 3 and 5 go with the trend, and waves 2 and 4 pull back against it. The motive waves usually break into five smaller waves and the pullbacks into three, which gives the pattern 5-3-5-3-5. A correction is commonly three waves, A, B and C. Corrections take more forms than impulses: a zigzag splits 5-3-5, a flat splits 3-3-5 and a triangle has five overlapping legs lettered A to E, each of three. That variety is why corrections are harder to label than impulses. A diagonal is a separate motive structure. An ending diagonal usually subdivides 3-3-3-3-3, so the 5-3-5-3-5 pattern does not cover it.
Waves nest. A five-wave move on a 4-hour chart can be wave 3 of a larger five on the daily chart, so a count only makes sense for one chart degree. Degree is not the same as timeframe: it is the size of the structure you are labelling. Pick the degree you trade and write it with the count.
Three rules and the rest
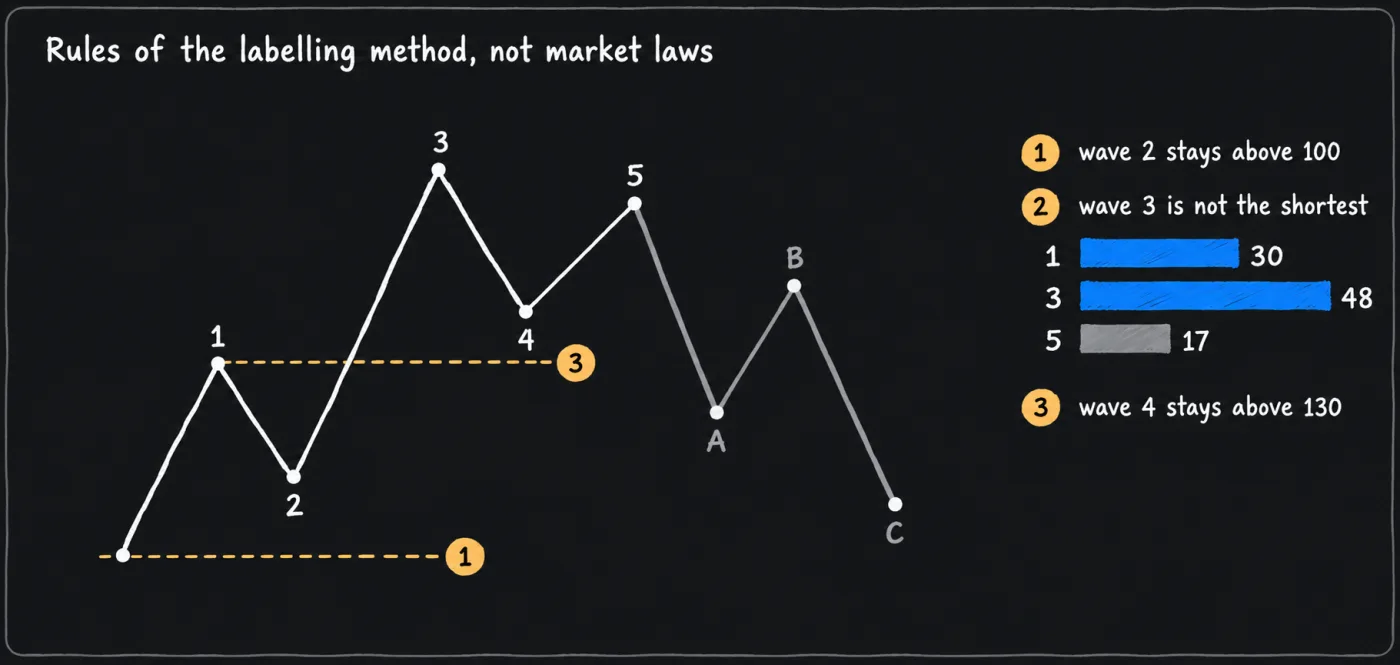
Three statements are the hard rules of the labelling method for an impulse. If price breaks one, the count is wrong and gets relabelled. The market has not broken a law. The wording below is for an uptrend, and a downtrend mirrors it.
- Wave 2 does not retrace past the start of wave 1.
- Wave 3 is never the shortest of waves 1, 3 and 5.
- Wave 4 does not enter the price range of wave 1. A diagonal is the usual exception, and there the overlap is expected.
Everything else taught on this page is a guideline, a tendency with exceptions. Named patterns such as diagonals and correction forms carry further requirements this page does not cover. Wave 3 is often the longest. Waves 2 and 4 tend to differ in form, one sharp and one sideways. Wave 5 can end short of wave 3's high, a truncation, and the rules allow it. Wave 1 and wave 5 are often similar in size when wave 3 is long. Traders also pair waves with Fibonacci ratios, such as wave 3 near 1.618 times wave 1, and this page counts those as guidelines too (see Fibonacci retracement for how the ratios are drawn). This page cites no test showing that counts predict direction better than chance, or that two analysts reach the same count.
Checking a count against the rules
For arithmetic only, assume swings of 100 to 130 (wave 1), back to 112 (wave 2), up to 160 (wave 3), back to 138 (wave 4) and up to 155 (wave 5).
| Check | Prices | Result |
|---|---|---|
| Rule 1 (uptrend) | Wave 2 low 112 is above the wave 1 start, 100 | Passes. Wave 2 retraced 18 of 30, which is 60% of wave 1. |
| Rule 2 | Lengths: wave 1 is 30, wave 3 is 48, wave 5 is 17 | Passes. Wave 3 is not the shortest. Wave 5 is. |
| Rule 3 | Wave 4 low 138 is above the wave 1 high, 130 | Passes. |
| Guideline | Wave 5 high 155 is below wave 3 high 160 | A truncation, which the rules allow. |
Passing the rules does not make the count right. It means the labels are allowed. The same swings can often be read another way, such as the first leg of a larger correction, so the plan needs a second count and a price that makes you switch to it. The rules help here: for a count that treats wave 2 as finished, a move below the wave 1 start, 100, means the count is wrong. The stop still goes beyond that level with a buffer, as stop-loss placement explains.
Why counts differ
Three choices decide a count, and each is a judgement: which swings are big enough to label, which chart degree you are on, and whether you measure waves in price or in percent. Which of waves 1, 3 and 5 is shortest can change between a linear and a log scale. On a messy chart, passing is a legitimate result. A count that fits only after price has moved is a description of the move.
Default settings
There is no indicator setting here. The table lists the standard structure and the conventions a count depends on.
| Item | Standard form | Status |
|---|---|---|
| Impulse | Five waves, 1 to 5, subdividing 5-3-5-3-5 | Published structure |
| Correction | Commonly three waves, A-B-C, in zigzag and flat forms. A triangle has five legs, A to E. Combinations exist. | Published structure |
| Hard rules | Wave 2 stays above wave 1's start, wave 3 is not the shortest, wave 4 stays out of wave 1's range | Rules of the method. Diagonals are the exception to the third. |
| Guidelines | Alternation, a long wave 3, wave 5 near wave 1, Fibonacci proportions | Tendencies with exceptions |
| Variation: scale | Linear or log, chosen once | Can change which wave is shortest |
| This manual's choice: degree | Label the timeframe you trade and one above it | The count must say which chart it belongs to |
How it is used in this manual's setups
The ending diagonal breakdown uses the diagonal exception to rule 3, a wedge in wave 5 or wave C whose legs overlap. The planned fifth wave exhaustion short and wave one dip buy are also wave-count setups. Each one needs a count written down before the trade, with its second count and its wrong-above or wrong-below price.
Because a count can differ between traders, testing a setup says to mark it before you look at what followed, or the test measures your hindsight.
Common mistakes
- Treating a guideline as a rule. Of the checks taught here, only the three rules end an impulse count. A wave 3 shorter than wave 1 is allowed, as long as it is not the shortest of waves 1, 3 and 5.
- Relabelling whenever price disagrees. Fix, in advance, the price at which the count is wrong, and leave it there.
- Counting without a degree. State the chart the count belongs to, or a move can be labelled two ways at once.
- Forcing a count onto a messy chart. Skip the chart. A pass is a finished decision.
- Trading a count with no stop. Place the stop at the price where the count fails, plus a buffer.
What this cannot tell you
A count cannot tell you which way price goes next. It states which labels the swings allow, and many chart sections allow more than one. It cannot say which of two valid counts is right, how long a wave will run or what form a correction will take. A passed rule check is a statement about the labels, not about price. And it cannot say which chart degree you should use, so two traders can both follow every rule and still disagree.
Questions
What are the Elliott Wave rules?
Three: wave 2 does not retrace past the start of wave 1, wave 3 is never the shortest of waves 1, 3 and 5, and wave 4 does not enter wave 1's price range, except in a diagonal. They are rules of the labelling method. A broken rule means the count is wrong.
Can two traders count the same chart differently?
Yes. They can choose different swings, different chart degrees or a different price scale, and each can follow every rule. That is why a plan needs a second count and a price at which it switches.
Is Elliott Wave required for the setups here?
Only for the three wave-count setups. The other setups run on levels, trendlines and indicators, and need no count.