Definition
Volatility is how far and how fast price moves, whatever the direction. It is measured from past candles as their size or from the spread of their percentage changes, or it is implied by options prices. A more volatile coin usually needs more room around a stop, and more room means a smaller position for the same planned loss.
Use it to decide how much room a stop needs and how large a position that stop allows.
How it works
Four ways to measure it
- Range. A candle's high minus its low, or that as a percentage of price. Simple, and one candle at a time.
- ATR. The average of true range over N candles, in price units. The ATR page has the formula and the published default of 14 with Wilder smoothing. Divide by price to get ATR percent before comparing coins.
- Standard deviation of returns. Take each candle's simple percentage change from the last close and measure how widely those changes scatter around their average. This is realised volatility, quoted per year when annualised. Many sources use log returns instead of simple ones, and for small changes the two are close. It uses closes only, so it misses a wick that came back, which ATR includes. The two numbers differ and neither is the correct one.
- Implied volatility. The annualised figure that makes an options pricing model match the market price of an option. It exists only for coins with an options market. It can include a premium for bearing risk, so it is not an unbiased forecast of realised volatility, and it has no direction.
Range, ATR and realised volatility are all taken from past candles. Implied volatility comes from a price, not from candles. They answer different questions and are not interchangeable. A futures chart gives you the first kind.
For arithmetic only, assume five daily changes of 2, -1, 3, -2 and 1 percent. The average is 0.6. The squared gaps from it are 1.96, 2.56, 5.76, 6.76 and 0.16, which sum to 17.2. Divide by 4, one less than the count, to get 4.3, the sample variance. Its square root, about 2.0736%, is the sample standard deviation. A real window is longer than five candles.
Annualising needs a day count
Volatility quoted per year scales the per-candle figure by the square root of the candles in a year. Crypto trades every day, so a year is 365 daily candles: square root about 19.1. A stock-market year of 252 trading days gives 15.9. Carrying the unrounded 2.0736%, that is about 39.6% with 365 and 32.9% with 252, for the same candles. Hourly candles number 8,760 a year and 4-hour candles 2,190. The scaling assumes each candle's variance is the same and its changes are not correlated with one another, which is an approximation, and clustering makes it rougher. State the day count whenever you quote an annual figure.
Why recent volatility is a starting point, not a forecast
Large moves tend to cluster with large moves, and calm with calm. Benoit Mandelbrot described it in 1963, and Robert Engle's ARCH model of 1982 was built to capture it. This page cites no measurement for any one coin. That is why a recent ATR is a reasonable first guess for how much room a stop needs. It is not a forecast, and a news event or a thin book can break the pattern in one candle.
From volatility to stop distance and size
The stop goes where the idea is wrong, plus a buffer, as stop-loss placement explains. Volatility enters in two places: the size of the buffer, and whether the distance to the level is small or large against a normal candle. A stop closer than one typical candle's range is a distance an average candle can cover.
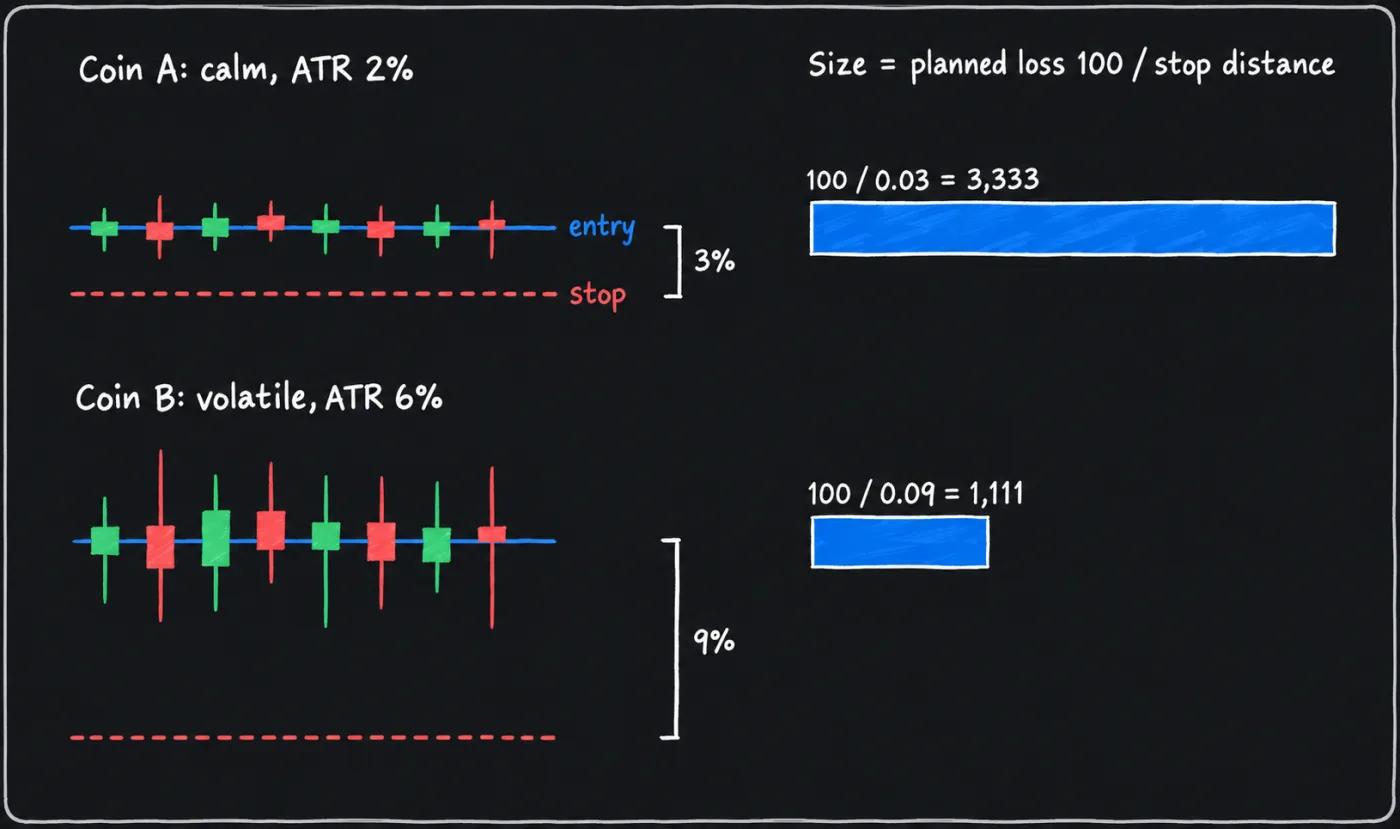
Then position sizing turns the distance into a quantity. For arithmetic only, assume a 10,000 account and a planned loss of 1%, or 100, inside this manual's house constraint of 1 to 2% per trade. It is a choice, not a recommended allocation. Assume two coins where the level each idea rests on, plus its buffer, happens to sit 1.5 times ATR(14) from entry, the low end of the 1.5 to 3 times range the ATR page calls commonly cited. That holds the structure constant, so the table shows volatility alone. Costs are left out.
| ATR percent | Stop distance | Position value | Share of account | |
|---|---|---|---|---|
| Coin A | 2% | 3% | 100 / 0.03 = 3,333 | 33% |
| Coin B | 6% | 9% | 100 / 0.09 = 1,111 | 11% |
Three times the volatility gives a third of the position, with the same planned loss of 100 if the stop fills at its price. A fast market can fill it worse, and then the realised loss is larger.
A calm coin is not automatically safe. Assume ATR percent of 0.2%, so a stop 0.3% away. The sum calls for 33,333, or 3.33 times the account, over the 3x ceiling, another house constraint. At 3x the most you can hold is 30,000, which puts 90 at stake. Take that or pass. Costs also take a larger share of a tight stop, as the trading costs and liquidity page shows.
A jump in volatility after entry does not change the position, which was sized from the stop at entry. It does raise the chance of slippage and gaps, which is how realised loss exceeds planned loss, so check the ticket's liquidation price against the stop.
Default settings
| Setting | Value | When traders use it |
|---|---|---|
| Published default: ATR | Length 14, Wilder smoothing | Wilder's definition and the default on the major charting platforms. Read it on the decision timeframe. |
| Variation: standard deviation of returns | A window of N candles, with no published default | Traders pick a window. This page names no standard one and cites no source for any. |
| Annualisation | Square root of candles per year, 365 days for crypto | Convention. 252 is the stock-market count. Quote the one you used. |
| Stop distance in the examples | 1.5 times ATR(14) from entry | The low end of a commonly cited ATR-only range of 1.5 to 3 times, an assumed example here and not a tested value. |
| Variation: realised versus implied | Realised from your chart, implied from an options venue | They measure different things. Do not compare them without saying which is which. |
How it is used in this manual's setups
Volatility sets the room around every stop and, through sizing, the position. The Chandelier Exit trails price by a multiple of ATR, so its line sits further away on a volatile coin. The ending diagonal breakdown says it does not fit a vertical, parabolic run, which is a volatility condition written into the setup. The volatility scanner lists the coins moving most right now. A recent surge may not show in ATR(14) yet, so check ATR percent on the chart you trade, which is also the manual route. Market conditions covers how volatility changes between conditions, and volume covers the other quantity scanners rank by.
Common mistakes
- Comparing raw ATR across coins. Convert to ATR percent first.
- Reading high volatility as direction or opportunity. It says candles are large. It does not say which way price goes.
- Sizing from a calm period. A stop distance fitted to last month's quiet can be too tight for the next move. Recompute from the current ATR.
- Annualising without a day count. A figure with no day count cannot be compared with another source's.
- Mixing realised and implied. One is from your candles and one is from options prices.
- Treating a quiet coin as low risk. A tight stop calls for a large position that the ceiling may cap, and a gap can still go through it.
What this cannot tell you
- How volatile the next candle will be. Range, ATR and realised volatility describe past candles, and implied volatility is a price that can carry a risk premium. A shock candle can arrive in a calm stretch.
- Which way price will move. Volatility has no sign. A rising reading appears in sell-offs and rallies alike.
- Whether a stop distance marks where the idea is wrong. A distance of 1.5 times ATR is a volatility exit. It says how far an ordinary candle goes, not where the idea fails.
- What a scanner's number means. Check which measure and which period a volatility list uses before comparing it with your own ATR.
Questions
How does volatility affect position size?
A more volatile coin usually needs more room around the stop, and more room means a smaller position for the same planned loss. In the table above, three times the ATR percent gives a third of the position. If the structure sets a fixed stop, the position follows that stop instead, and a distance too large for your budget is a pass.
What is the difference between realised and implied volatility?
Realised comes from past prices on your chart. Implied comes from options prices and can include a premium for bearing risk, so it is not a clean forecast. Neither tells you direction.