Definition
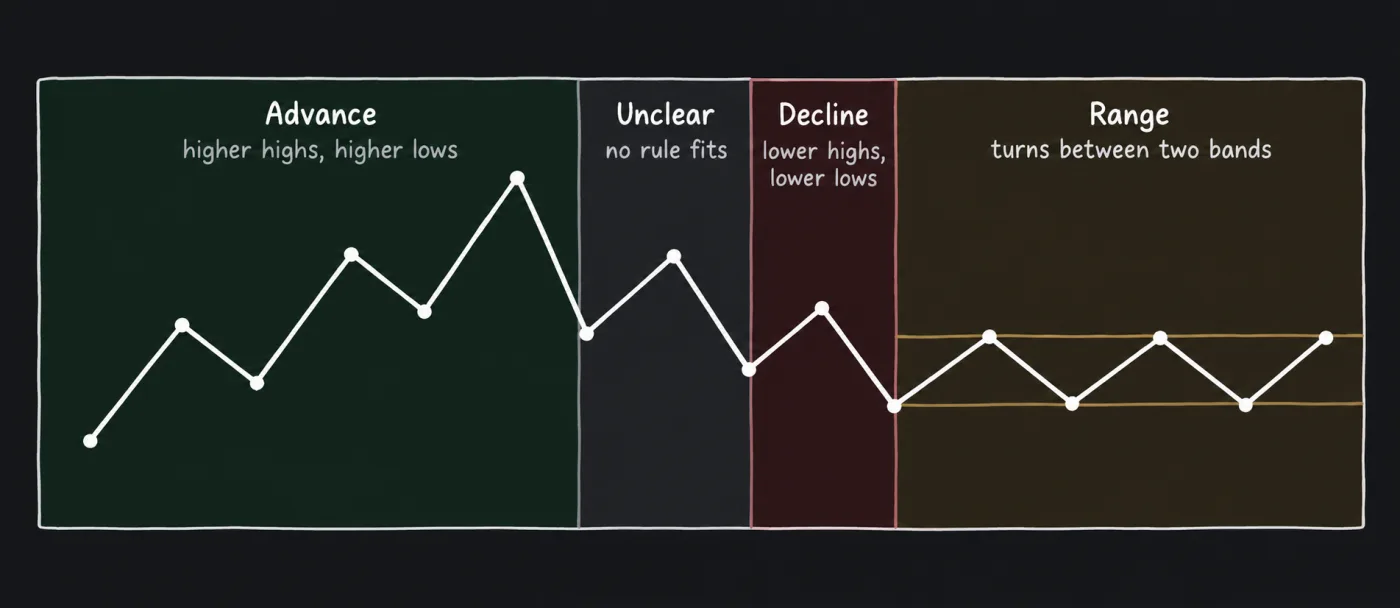
A market cycle, as traders use the term, is a sequence of phases they name on a chart: an advance (a bull phase), a decline (a bear phase) and sideways trading (a range). The labels describe what price has already done on a timeframe you choose, and they are applied after the candles print. Whether the phases repeat in a fixed pattern is a belief, covered below.
Use it to decide which of your setups fit current conditions, and whether to pass. Two careful traders can read the same chart differently: one sees a pause inside an advance, the other the start of a decline.
How it works
Label the phase with a rule you wrote first
There is no published standard for naming a phase, so write your own rule on the chart you read for the larger trend. Two common ones:
- Structure. An advance has higher swing highs and higher swing lows. A decline has lower highs and lower lows. A range keeps turning between a support band and a resistance band, as support and resistance describes.
- Moving average. Price above or below a long moving average, with the average's slope as a second condition. Moving averages covers the settings.
Use one rule per chart. If you use both and they disagree, the label is unclear. Unclear is a fourth label, for when no rule fits. A plan that needs a trend passes in an unclear phase, and that pass is a finished decision.
Update the label only on closed candles, and write down what would change it. For an advance, a close below the last swing low moves the label to unclear, and a lower high followed by a lower low is what a decline needs. At the time, no rule can tell a pullback inside an advance from the first leg of a decline. That is the limit of every label. It describes the past and changes after price has moved.
Phases nest. A decline on the 4-hour chart can sit inside an advance on the daily chart, so name the timeframe with the label. Multi-timeframe analysis covers which chart is which.
What each phase asks of a plan
A setup is written for a condition. The phase label does not predict that the condition will appear, it checks whether the setup's own assumption holds before you write a plan.
| Phase | What a plan assumes there | What to recompute |
|---|---|---|
| Advance | With-trend triggers: continuation breaks and pullbacks. A counter-trend short is a different plan and has to state its own reason | ATR(14) and the stop distance, then the size |
| Decline | The mirror: with-trend shorts. A long against it is a different plan with its own stated reason | The same |
| Range | Edge-to-edge moves between two bands. A breakout trigger can fire and then fail back inside | Where the bands are, and the room between them |
| Unclear | Nothing that needs a trend. Those plans pass | Nothing until the label is clear |
Two setups here state the condition themselves. The ending diagonal breakdown is a counter-trend short after a long advance, and its page says it does not fit a coin that has gone nowhere for weeks. The Chandelier Exit page tells you to skip sideways coins, where the line flips on every swing.
Phase never changes the house constraints. A planned loss of 1 to 2% and a ceiling of 3x are this manual's choices, with lower allowed, and a bull phase is not a reason to raise either. Because volatility can differ between phases, recompute the stop distance and size of a new plan from current ATR percent, as that page shows. An open position keeps the size it was set with.
Cycle narratives are beliefs
Some traders hold that crypto moves in a repeating cycle. The best known belief ties Bitcoin's cycle to the halving, the scheduled cut by half in the new bitcoin paid per block, which comes every 210,000 blocks, about four years at the target rate of one block per ten minutes. Others hold that cycles follow liquidity, interest rates or sentiment, that smaller coins rotate in turn, or that certain months or weekdays behave in a set way.
State what the belief gets right. Markets do alternate between trending and ranging, and appetite for risk does swing. Then the limits. For the halving belief the sample is a few cycles in one coin, so any pattern tested on it rests on a very small count. The liquidity, sentiment and calendar beliefs each have their own counts and overlap problems, and this page cites none. Each is read after the fact, and a story that fits the past can be bent to fit the present. This page cites no test showing that any cycle narrative predicts direction.
A plan trigger must be visible on the chart, and a narrative is not. If you hold one, write it as context, or as a reason to pass or size down. Never use it to widen a stop, raise size or skip an invalidation.
Default settings
This page cites no published standard for labelling phases, so the table lists common approaches. Each is a choice you write into the plan, and none is this manual's rule.
| Item | Convention | Status and limitation |
|---|---|---|
| Labels | Advance, decline, range, and unclear | Convention. Four labels, not a forecast. |
| Rule | Swing structure: higher highs and lows, lower highs and lows, or turning between two bands | Common convention. Two traders can mark the swings differently. |
| Variation: moving average | Price against a long moving average and its slope | Common convention. It lags, and it flips often in a range. |
| Timeframe | The chart you read for the larger trend | Your choice, written in the charter. A different chart can give a different label. |
| When to update | On a closed candle, against a change condition written in advance | Your choice. Updating on every candle makes the label a mood. |
How it is used in this manual's setups
The label is the trend note in the observe step of the decision cycle, and it picks which setups to check against a coin. A label of unclear is a pass for any setup that needs a trend. The market conditions chapter works through the phases. This page names no setup as the one for any phase, because a setup's own conditions decide whether it applies.
Common mistakes
- Labelling after the move. Write the rule and the change condition before the candle closes.
- Reading the phase as a forecast. A label says what price did. It does not say what comes next.
- Planning around a calendar. A month or a cycle year is not a trigger. If a plan needs one, it has no trigger.
- Raising size in a bull phase. The 1 to 2% and 3x constraints do not move with the phase.
- Using one coin's label for another. Label the coin you trade, on your own chart.
- Flipping the label on every candle. Update on closes against a written condition.
What this cannot tell you
- When a phase ends. A range can break either way, and an advance can stall without a decline. This page cites no test of how long a phase lasts.
- Whether the cycle will repeat. A halving-based or four-year pattern is a belief with a very small sample. It cannot be a plan condition.
- Whether the present stretch is a pause or a reversal. A pullback inside an advance and the start of a decline look the same until later candles arrive.
- What other coins will do. A label on one chart does not establish the label for a coin you have not charted, even where coins share exposure.
Questions
What are the phases of a crypto market cycle?
Traders usually name an advance, a decline and a range. The names are applied after price has moved, using a rule such as swing structure, so they describe the past and can change.
Does the halving cause crypto cycles?
Some traders believe so, and others point to liquidity and sentiment. This page cites no test showing that a halving-based pattern predicts direction, and the sample is a few cycles in one coin.
Which setups fit a bear market?
This page names none. A setup written for a downtrend assumes one, so check its conditions on your chart and recompute the stop and size of a new plan from current ATR. A plan that needs a trend passes when the phase is unclear.