Definition
A candlestick reversal pattern is a shape made by one to three candles that traders read as the other side stepping in at a turn. The shapes are defined by the open, high, low and close. They measure how one period ended against how it began, nothing more.
A pattern is a candidate, not a trigger. It becomes part of a plan only with three things around it: a trend you defined in writing before it, a support or resistance band marked and dated before it, and a close beyond its far end. Use this page to decide whether a candle at a level is a candidate your plan can use, or noise to skip.
How it works
One candle is a compressed period
A candle records four prices. The body runs from the open to the close. The wicks show how far price went beyond the body before the period ended. A long lower wick says price traded well below the close and was pushed back. A long upper wick says the same from above. The belief behind reversal patterns is that such a push-back marks buyers or sellers stepping in. It is a plausible story, and this page cites no test that a pattern reverses price more often than chance.
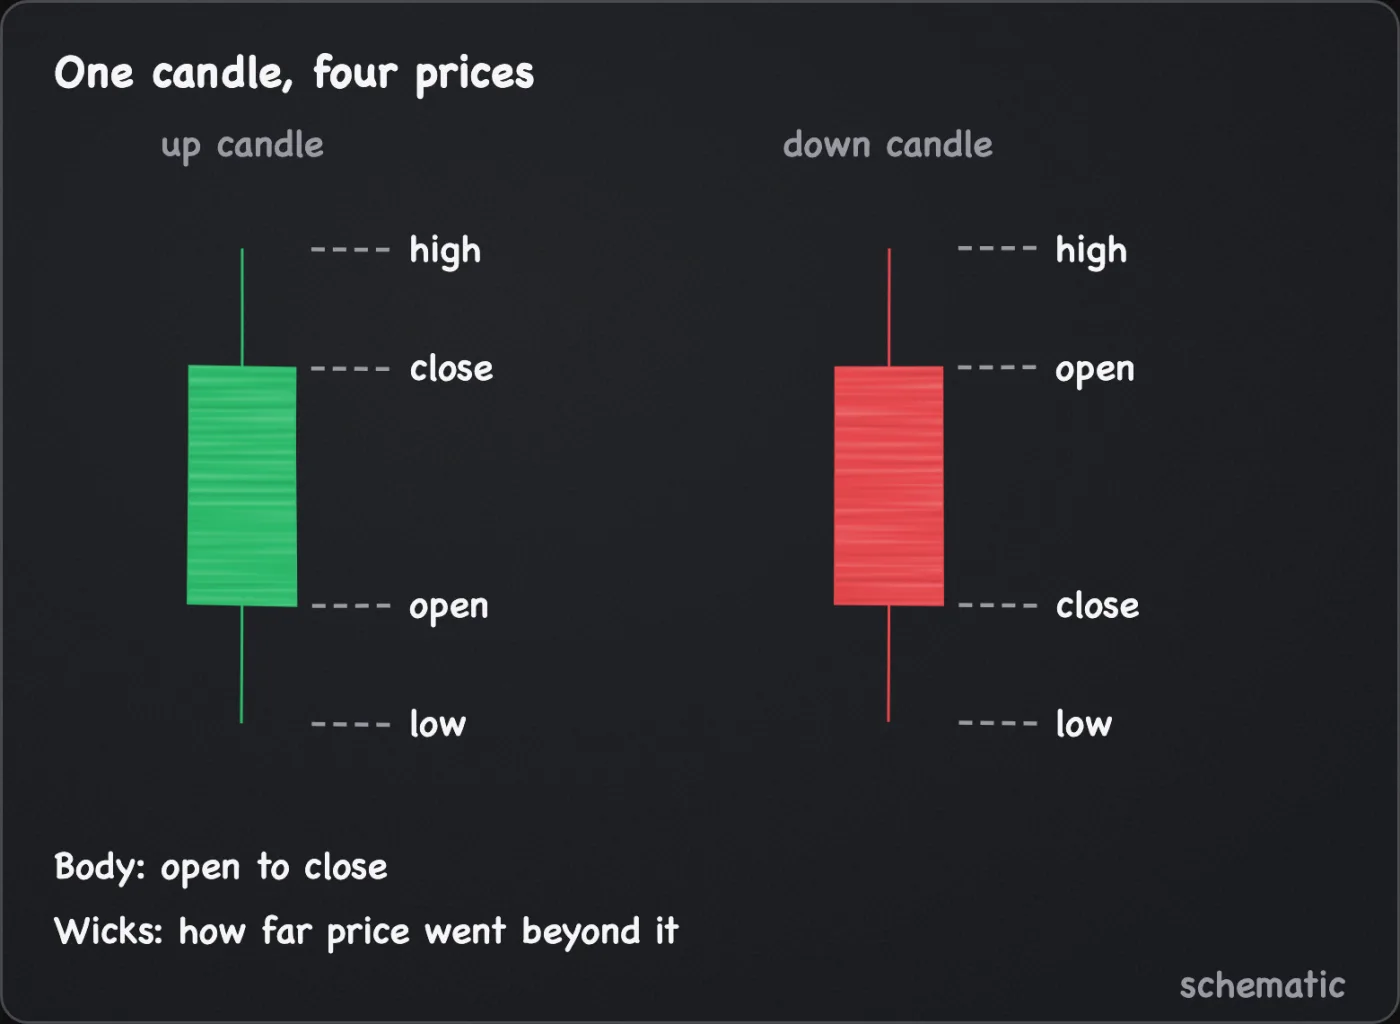
Candles are slices of time cut at an arbitrary boundary. Exchanges and chart settings can cut candles at different hours, daily candles especially, so the same trades can produce a hammer on one feed and an ordinary candle on another. Read patterns on the chart your plan names, and do not compare across feeds.
The patterns
| Pattern | Shape (conventions) | Role here |
|---|---|---|
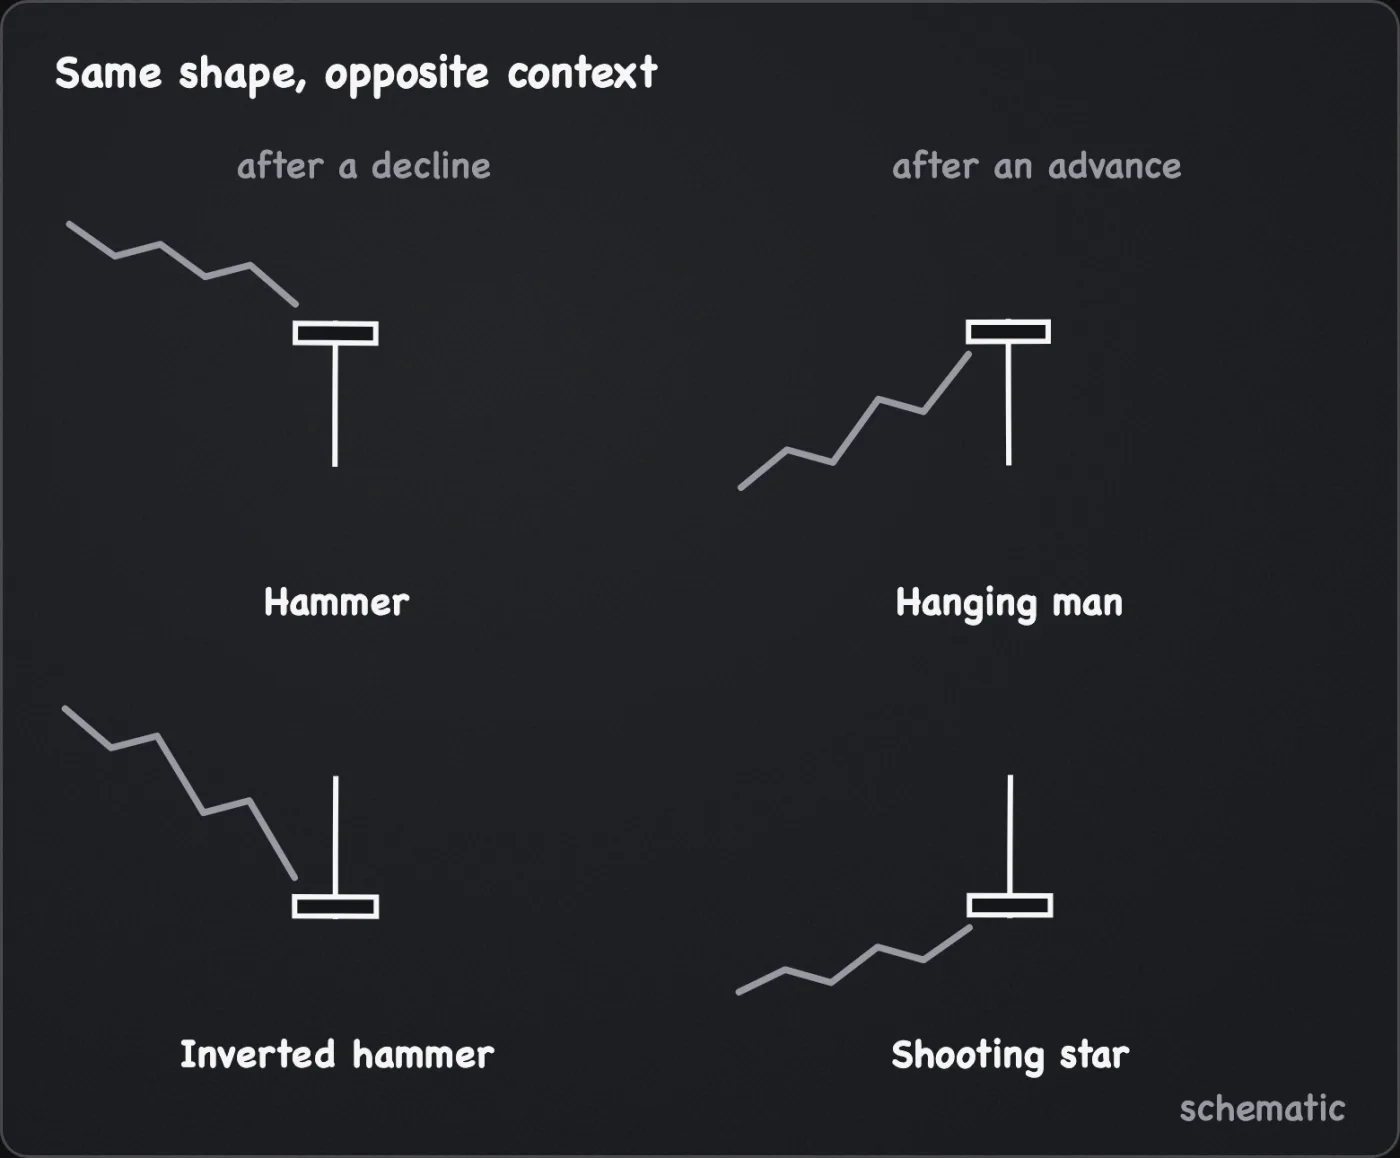
| Hammer | Small body in the upper part of the range, lower wick at least 2x the body (some traders use 3x), little or no upper wick. After a decline. | Candidate |
| Hanging man | The same shape, after an advance. | Candidate |
| Inverted hammer | Small body near the low, upper wick at least 2x the body, little or no lower wick. After a decline. | Candidate |
| Shooting star | The same shape, after an advance. | Candidate |
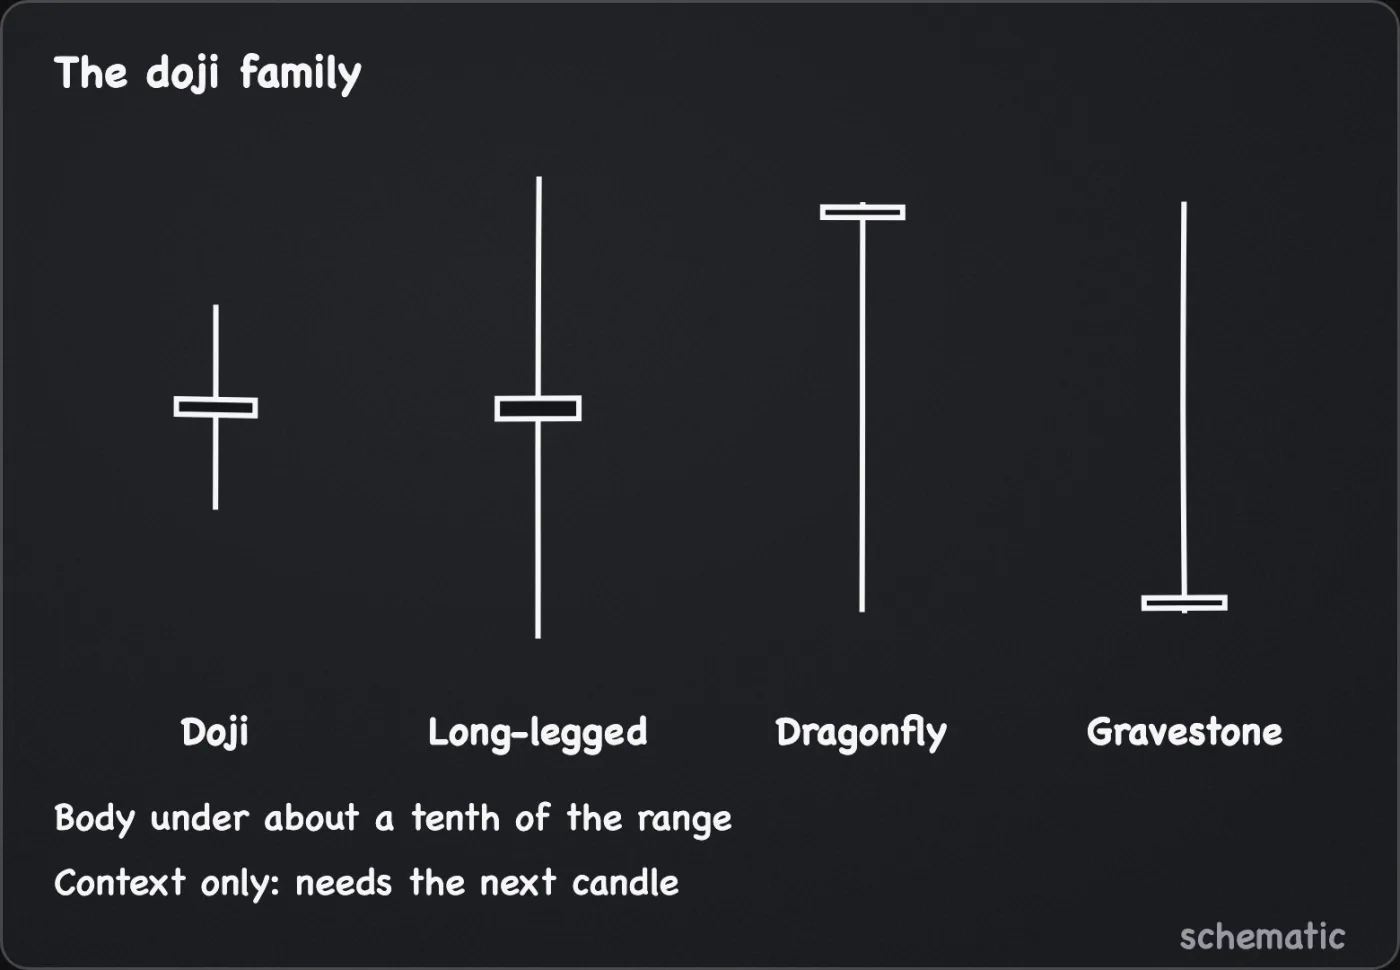
| Doji | Open and close nearly equal. A common cut is a body under about a tenth of the high-to-low range. Variants: long-legged (long wicks both sides), dragonfly (long lower wick, open and close near the high), gravestone (long upper wick, open and close near the low). | Context only |
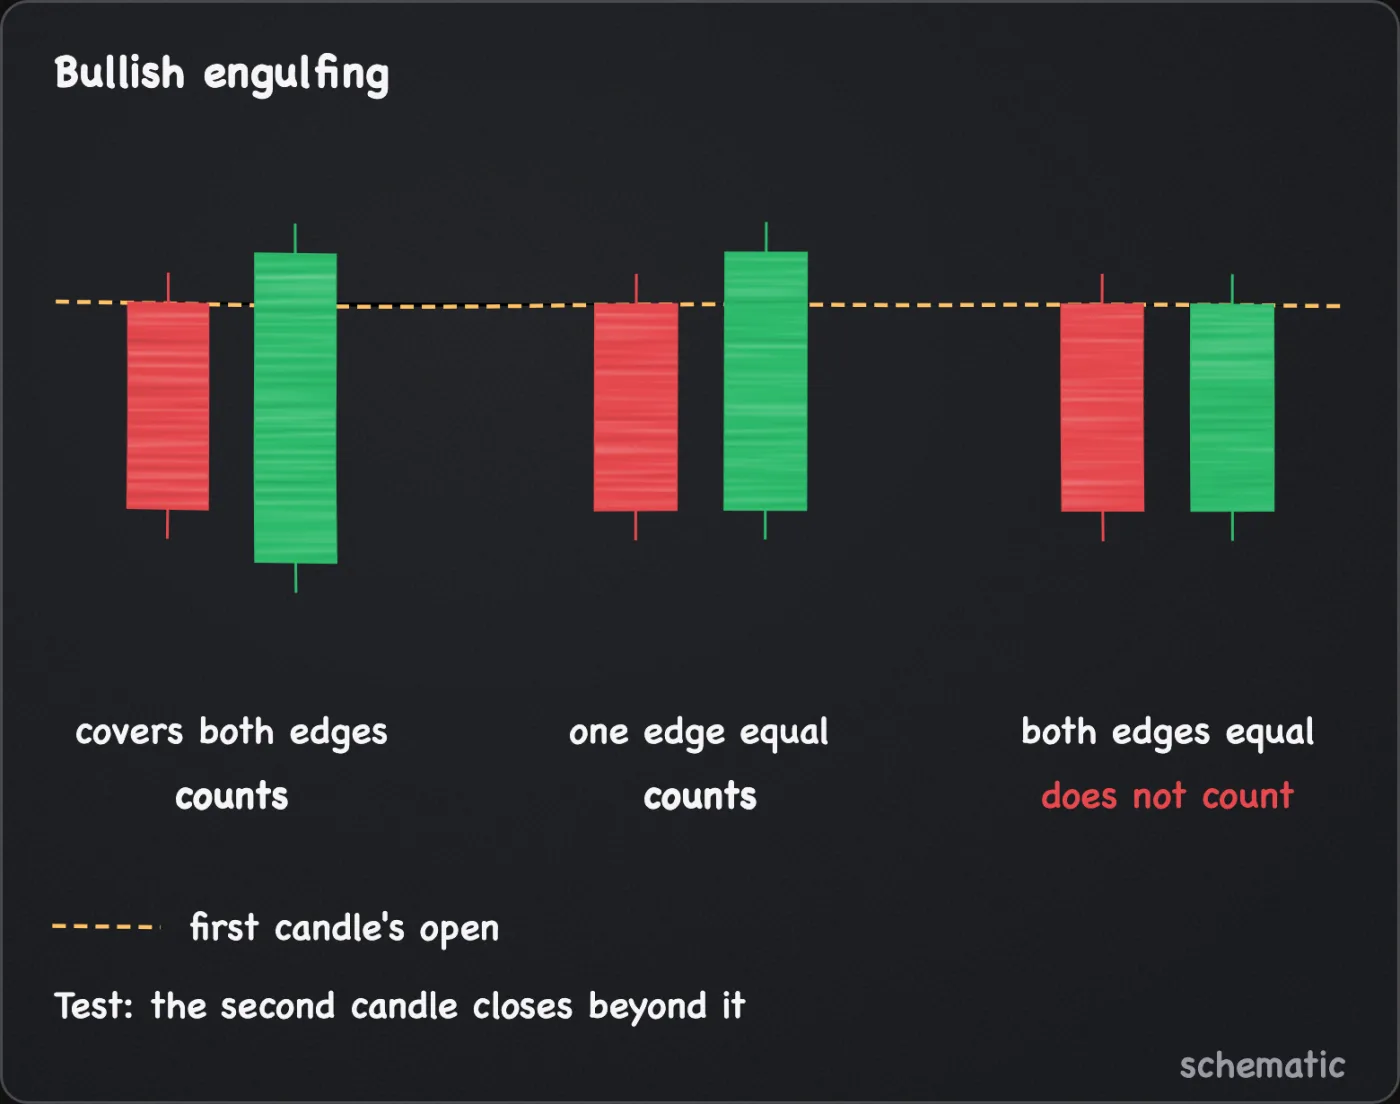
| Bullish engulfing | A down candle, then an up candle whose body covers the first body; one edge may be equal, not both. | Candidate |
| Bearish engulfing | An up candle, then a down candle whose body covers the first body; one edge may be equal, not both. | Candidate |
| Harami | A large candle, then a smaller one whose body sits inside the first body. The second is usually the other colour, though broader definitions allow either. | Context only |
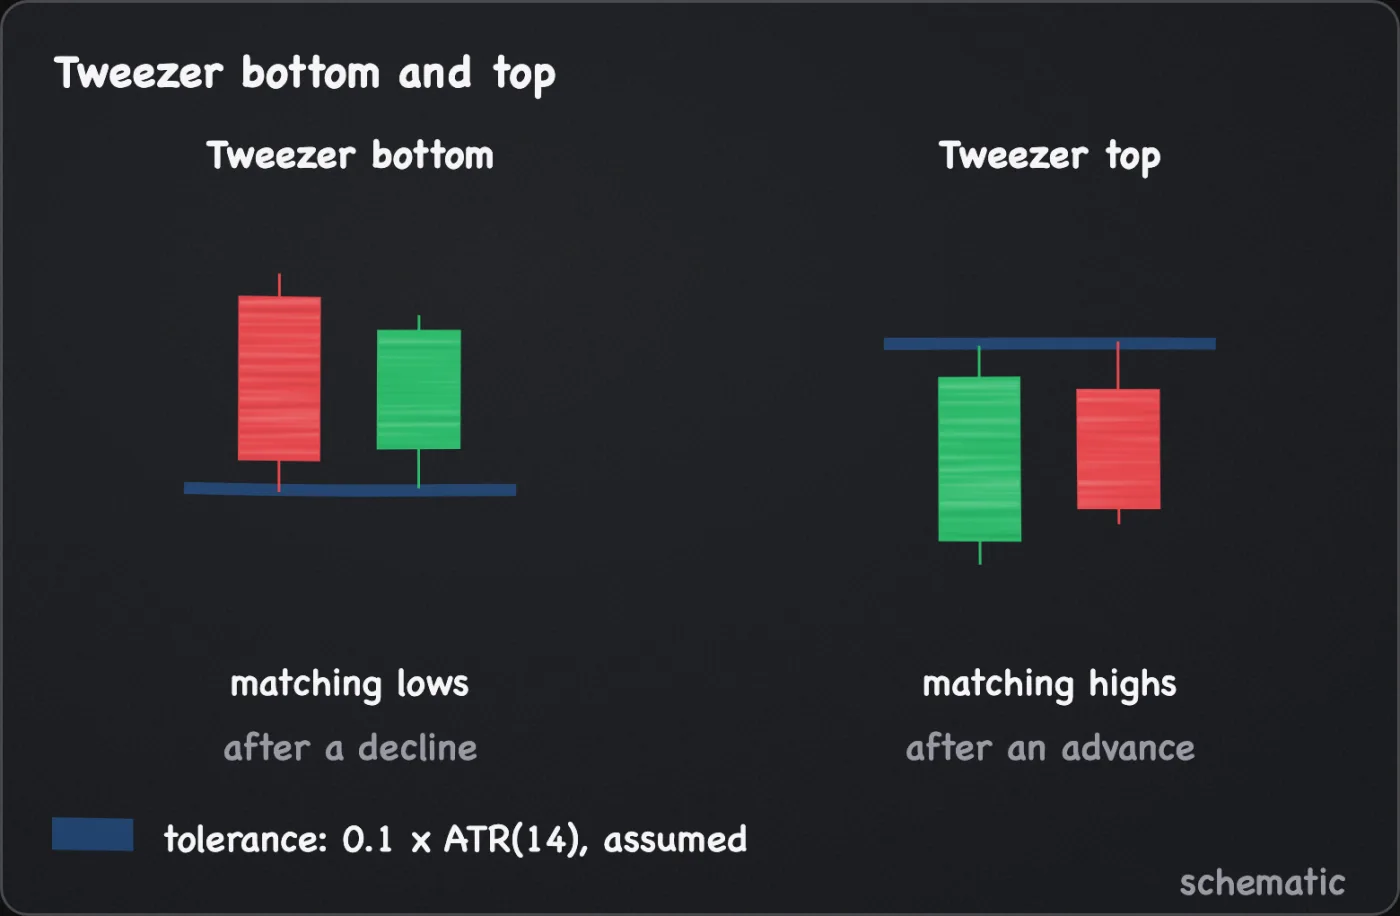
| Tweezer bottom or top | Two adjacent candles (some count candles a few apart) with matching lows (bottom, after a decline) or highs (top, after an advance), within a tolerance you fix, assumed 0.1 x ATR(14). | Candidate |
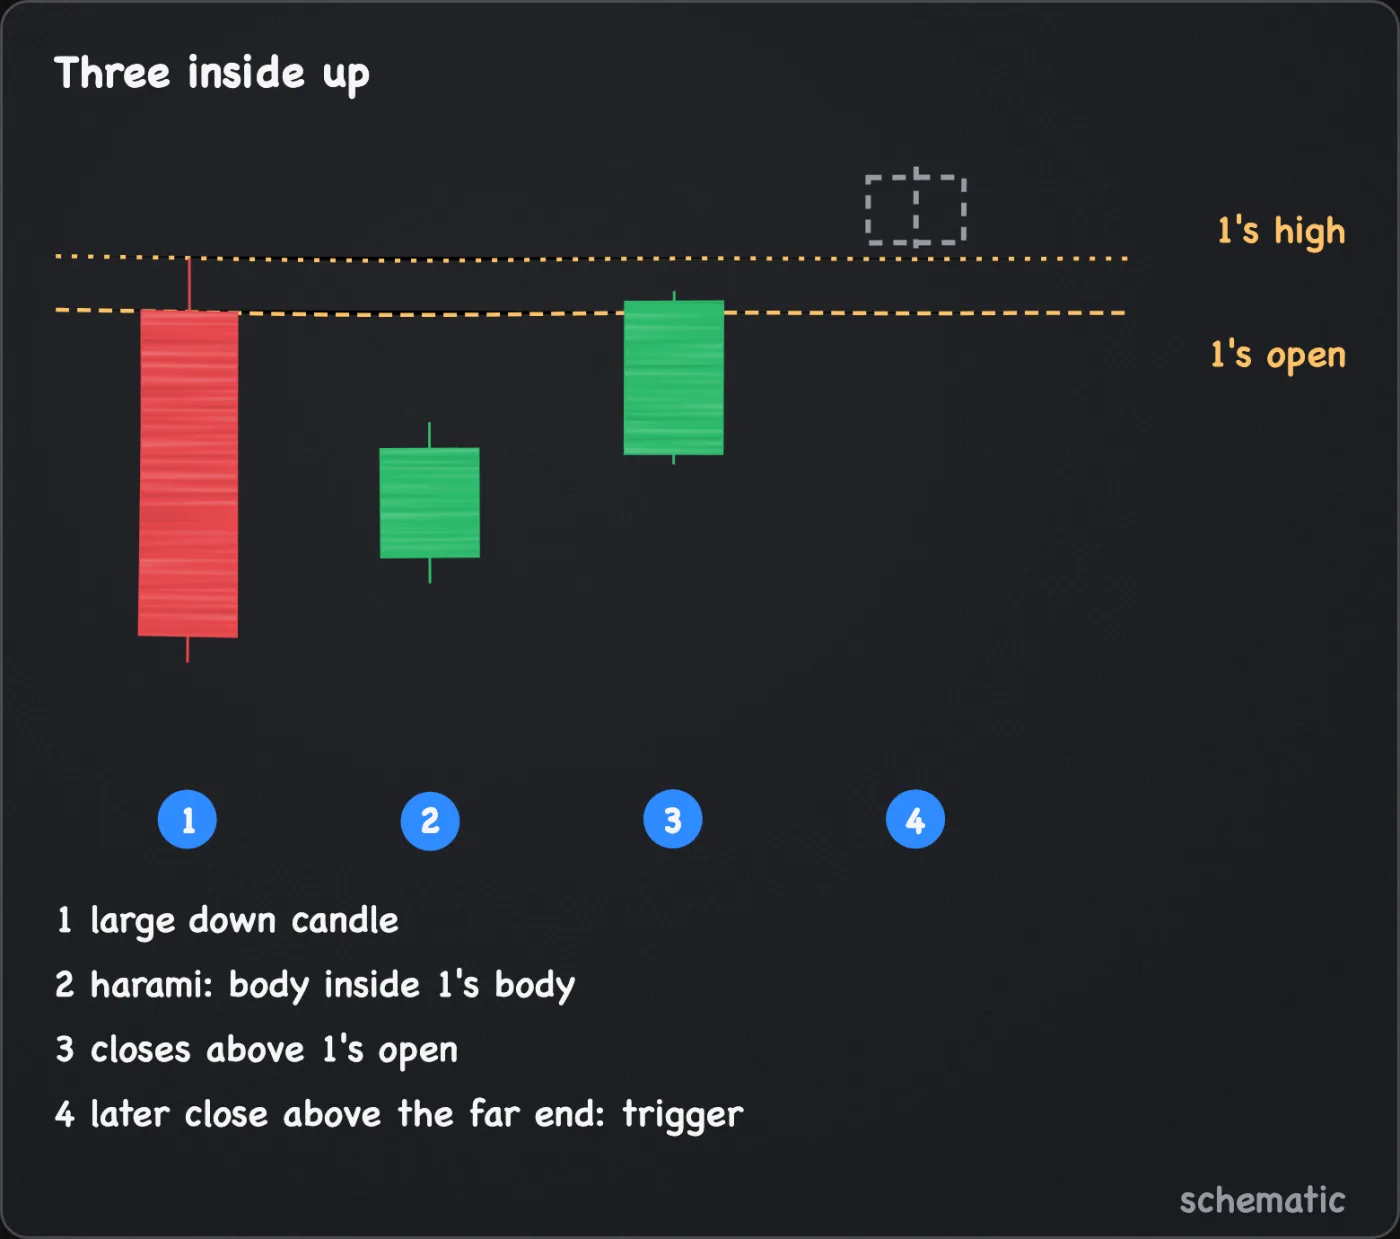
| Three inside up or down | A large candle, a harami candle in the other colour, then a third candle that closes beyond the first candle's open (above it for an up pattern, below it for a down one). Some require a close beyond the first candle's far extreme, its high for an up pattern and its low for a down one. | Candidate |
The third candle of a three inside pattern completes it. The trigger is still a later close beyond the pattern's far end.
A hammer and a hanging man are the same shape. The name comes from where it sits, so a shape with no trend before it has no name worth acting on.
A doji is indecision, a small body after a period that might still have moved a lot. It says the open and close agreed, not who was stronger. A harami is a pause. Neither is a trigger, because each needs the next candle to show which way the pause resolved.
On a market that trades around the clock, a candle usually opens near the previous close. So an engulfing pattern mostly reduces to one test: the second candle closes beyond the first candle's open.
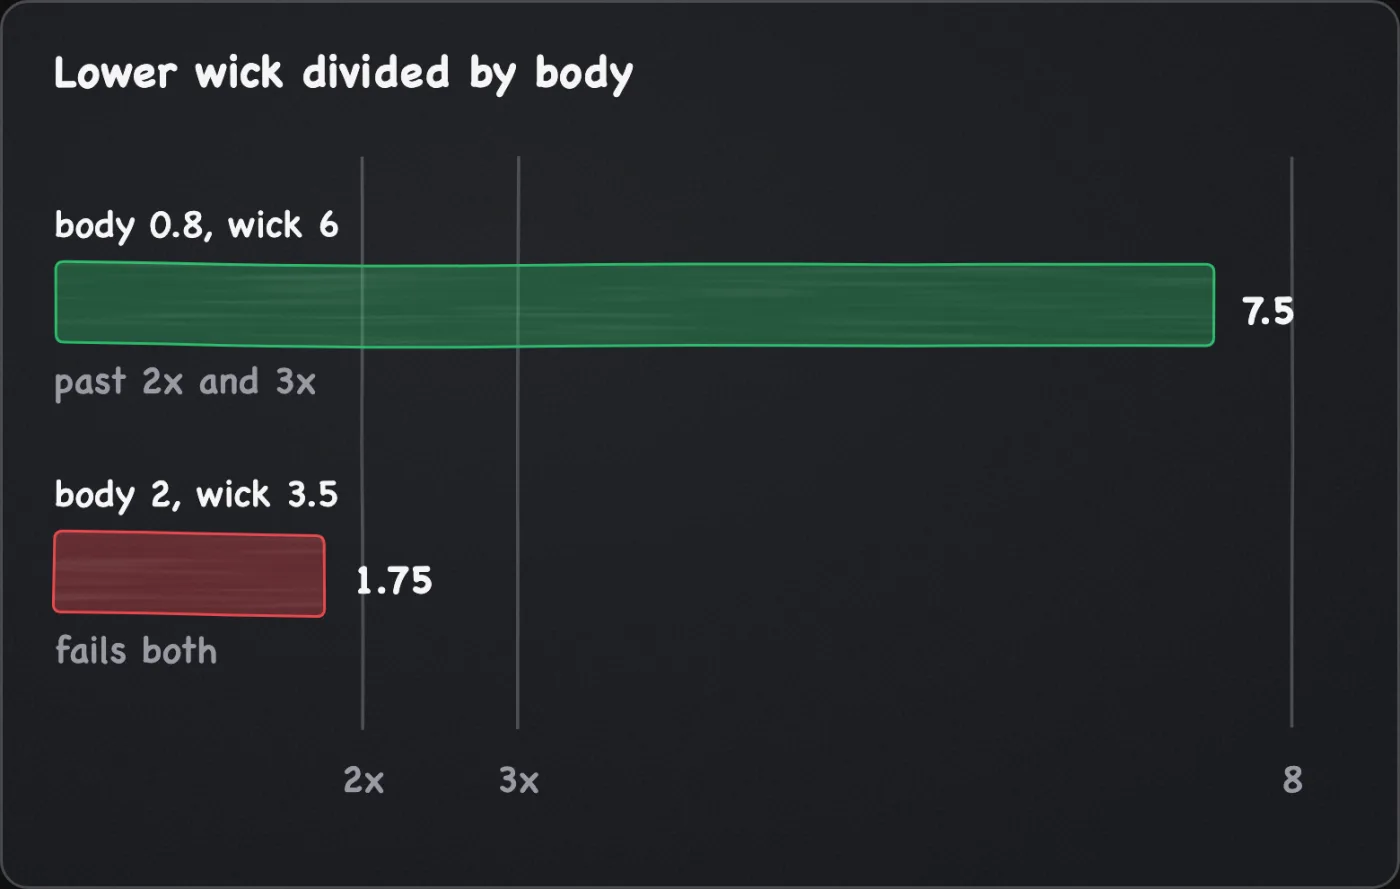
For arithmetic only, assume a 4-hour candle opens at 100, trades up to 101, down to 94 and closes at 100.8. The body is 0.8 and the lower wick is 6, a ratio of 7.5, past both the 2x and the 3x conventions. A candle with a body of 2 and a lower wick of 3.5 has a ratio of 1.75 and fails both. The ratio is a convention and the page cites no test of any value.
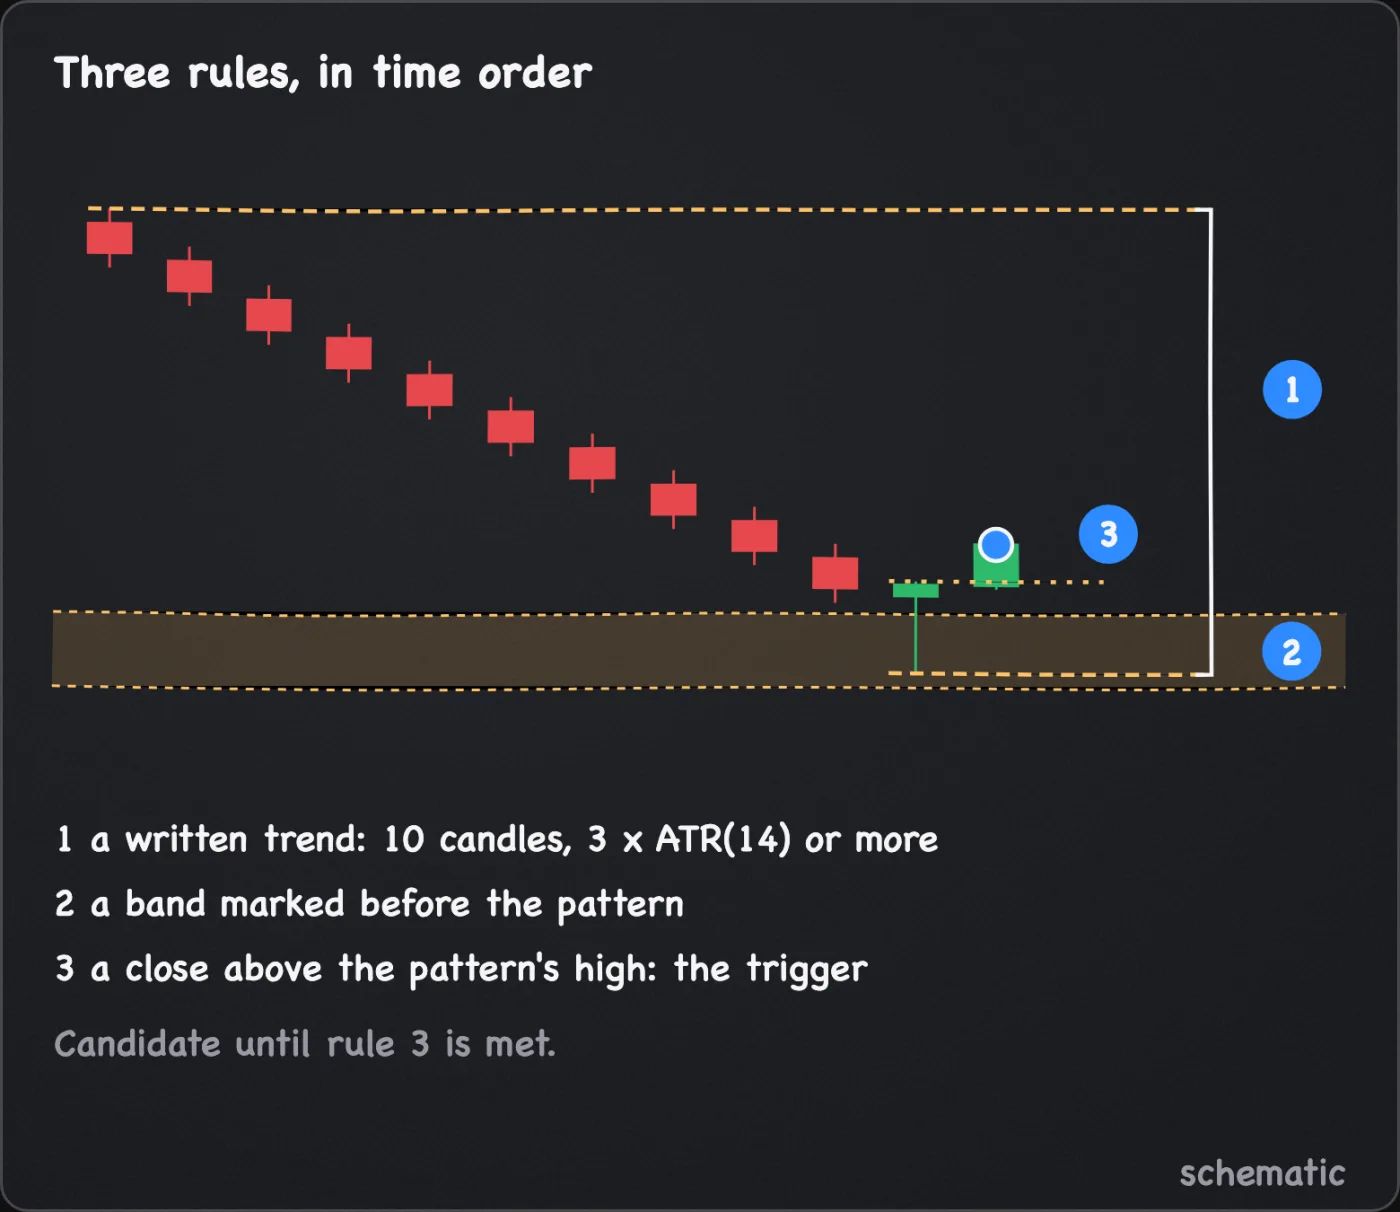
Three context rules
A trend you defined in writing. A reversal needs something to reverse. Write the definition before the pattern prints, for example: the highest high of the 10 candles before the pattern's first candle is at least 3 x ATR(14) above the pattern's lowest low (an assumed filter, not a full definition of a trend). Without a written definition, any pause in a drift looks like the end of a trend.
A band marked and dated before the pattern. The pattern sits inside a support or resistance band you drew before its first candle, from touches that were already on the chart. A band drawn afterward, around the hammer's own wick, always fits. Also note the overlap: a long wick into a band and a touch of the band are largely one observation, so count them as one reason, not two.
A close beyond the far end. For a long, wait for a decision-timeframe close above the highest high of the pattern's candles. For a short, a close below the lowest low. Until that close, the pattern is a candidate. The close is the trigger. The stop goes beyond the pattern's own extreme, and a setup may also weigh the edge of the band, as the reversal candle setup does. So the shape of the pattern also sets the size.
The shape sets the stop
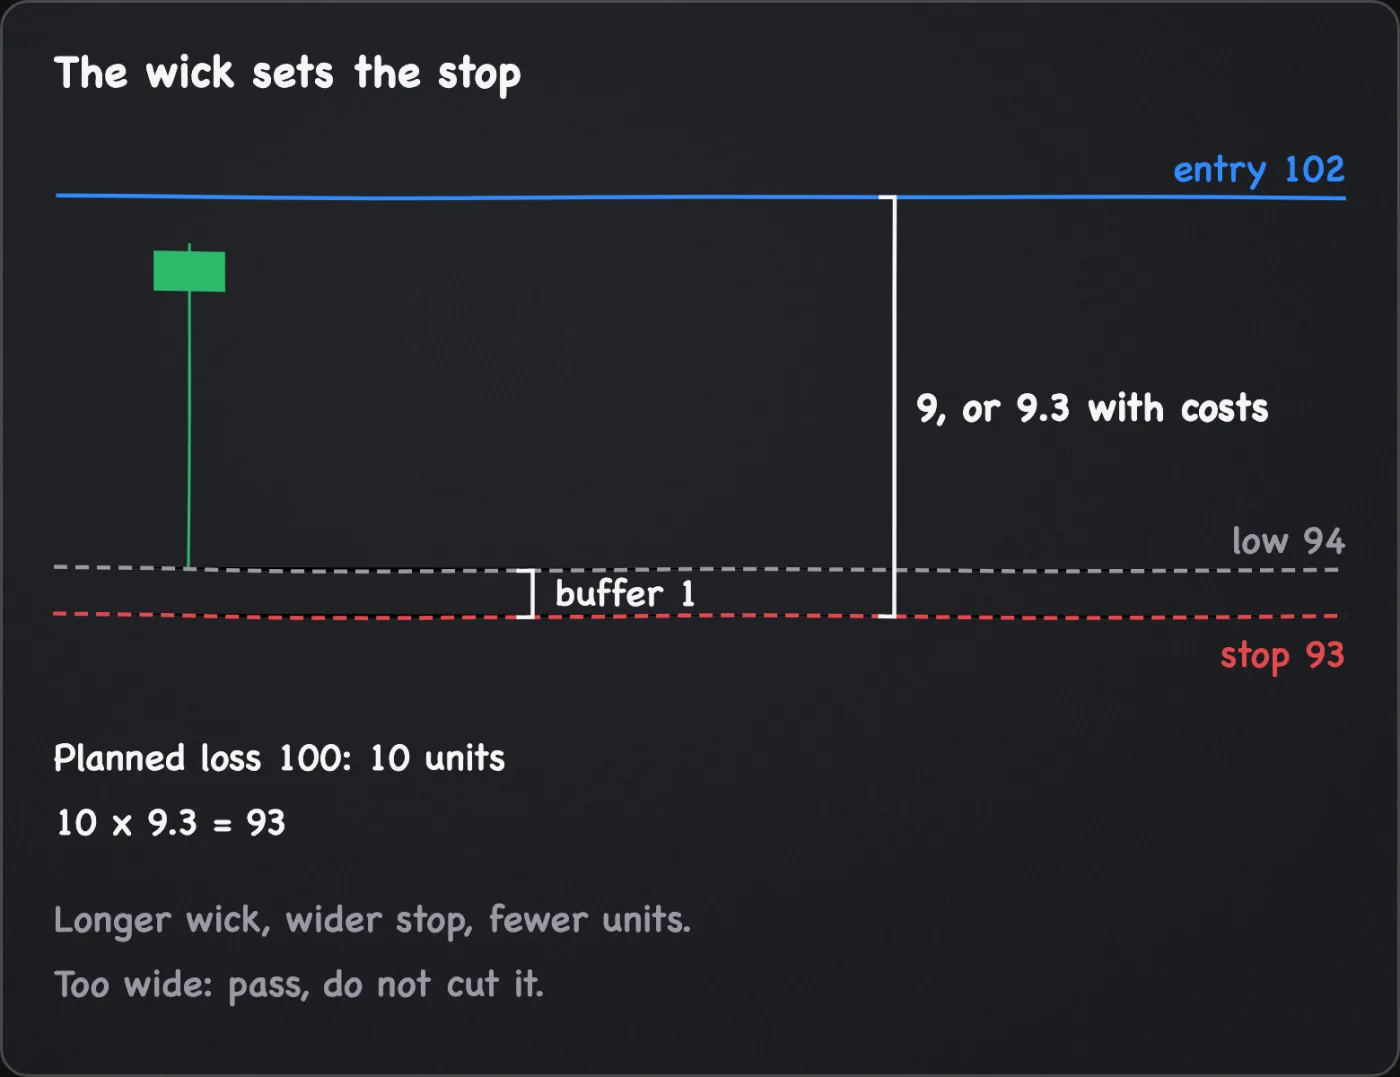
A good hammer has a long wick, and the stop belongs beyond the wick. In the example above, a close at 102 for the trigger and an assumed buffer of 0.5 x ATR(14) with ATR(14) at 2 put the stop at 94 - 1 = 93. The distance is 9, or 9.3 with an assumed allowance of 0.3 for costs. A planned loss of 100 on a 10,000 account buys 10 whole units (assume), for a planned loss with costs of 93. The longer the wick, the wider the stop and the smaller the position. If the size does not fit the risk budget, the answer is to pass, not to cut the stop to the body. The stop-loss placement page explains why.
Default settings
No published default exists for these shapes, so the table lists common conventions. Each is a choice you write into the plan.
| Item | Value | Status and limitation |
|---|---|---|
| Wick-to-body ratio | Wick at least 2x the body | Common convention. 3x is a stricter variation that passes fewer candles. |
| Doji body | Under about a tenth of the range | Common convention. A tighter cut finds fewer dojis. |
| Engulfing | Body covers body; one edge may be equal, not both | Common convention. Variation: range covers range, which is stricter. |
| Tweezer match | Within 0.1 x ATR(14) | Assumed example. A looser match calls more pairs tweezers. |
| Third candle of three inside | Closes beyond the first candle's open | Common convention. Variation: beyond the first candle's high for an up pattern, its low for a down one. |
| Prior trend | Written before the pattern, for example a fall of 3 x ATR(14) over 10 candles | Assumed example. A shorter or smaller definition calls more patterns valid. |
| Confirmation | A close beyond the pattern's far end | This manual's rule for using a pattern in a plan. It enters later at a worse price. |
How it is used in this manual's setups
- Reversal candle at support long. A hammer, bullish engulfing or the third candle of a three inside up, inside a band marked before the pattern.
- Failed breakout wick short. A relative of the shooting star at resistance, stricter on location and trigger and looser on shape. It asks for a band marked first, a spike of a fixed size beyond it and a close back under the band's lower edge, which can print on the spike candle itself. That trigger is its own, not the later close this page asks for.
- Kijun-sen reclaim long. The Kijun hold variation reads a reversal candle at the line.
- Breakouts and retests. A rejection candle at a retest is the same wick idea at a broken level.
Common mistakes
- Taking a pattern with no trend or level. A hammer in the middle of a range is a small-bodied candle. Check the three context rules.
- Entering on the pattern's own close. Wait for the close beyond its far end.
- Scanning back for patterns that worked. Hindsight selects the winners. Mark the band and the trend before the candles print.
- Shrinking the stop to fit the budget. A long wick means a wide stop. Take the smaller size or pass.
- Tuning the ratio after a miss. A setting fitted to the last failure is fitted to it.
- Comparing feeds. Candle boundaries differ by exchange and chart. Use one chart.
What this cannot tell you
- Whether a pattern reverses price. This page cites no test of any pattern's reversal rate, and popular success tables are unsourced here.
- Who was trapped. A long wick shows price went there and left. It does not show which side was caught, and volume on one candle does not split that.
- What a doji means. It is a candle whose open and close are close together. The range can be large, and the cause can be anything.
- What the next candle does. A confirming close shows where the last candle settled, not where the next one will. A candle after a harami can also stay indecisive.
- The path inside a candle. Open, high, low and close do not show whether the high or the low came first.
Questions
What is the difference between a hammer and a hanging man?
Nothing in the shape. A hammer follows a decline, a hanging man follows an advance. The name tells you which trend the trader assumed, and the plan needs that trend written down.
Are candlestick patterns reliable?
This page cites no test of any pattern, so it makes no claim either way. Used as the manual does, with a defined trend, a band marked earlier and a confirming close, a pattern is a condition in a plan that can fail. It is judged by whether the plan's rules were followed.
Does a doji mean the trend is ending?
No. It means the period opened and closed near the same price. A doji can print inside a trend that goes on. Treat one as a reason to wait for the next close.