Crypto risk management for beginners is a set of limits written before any trade: a planned loss per trade (1 to 2% of the account is this manual's house constraint), a size that follows from the stop, and limits on the planned loss of several trades open at once. This chapter ends in a one-page risk budget sheet.
A trade can pass every test you set for it and still leave the account carrying more than you meant. Each trade is sized alone, from its own stop, and the sum cannot see the others: four longs in coins that move together can stop out as one trade four times the size. For one trade, this manual puts the stop first, because it marks where the idea is wrong, and a size chosen first turns the stop into the loss you can stand. Size is then the planned loss in cash divided by the stop distance plus costs per unit, and the leverage setting comes last. The limit: a planned loss is the loss if the stop fills at its price, costs allowed for. A gap or heavier costs can make the realised loss larger, and nothing here says whether a plan earns money.
| Line | What you write | Test it must pass |
|---|---|---|
| Planned loss per trade | A percent from 1 to 2, or lower, and its cash figure at current equity. | Is the cash figure written beside the percent? |
| Leverage ceiling | 3x or lower, for the order-screen setting and for all position values added over equity. | Do both pass before every order? |
| Correlated groups | How you group positions, and a cap per group equal to your per-trade limit. | Can you say which group a new idea would join? |
| Total open planned loss | A cap on planned losses summed over open positions, in cash. This manual's is 4%. | Does the sum with the new trade stay at or under it? |
| Pause trigger | Your own fall, in R, from the highest running total of closed trades, net of costs, set before you trade. R is one trade's planned loss, so a full stop-out is -1R. The linked page's examples assume 6R, an example and not this manual's figure. | Can you say how many full stop-outs in a row fire it? |
| Daily loss limit | Your own figure in R, or "none", what counts as a day, and what you do when it is hit. This manual sets none. | Can you tell at any moment whether it is hit? |
| Sizing formula | Units = planned loss in cash / (stop distance + cost per unit), rounded down to a size the contract allows. Cost per unit: fees and funding for the planned hold from your fact sheet, plus a spread and slippage allowance from your recent fills. | Is the contract linear (profit and loss in the quote currency), and is every term filled but the stop distance? |
After the sum, check in this order: no pause is active, the ceiling, the ticket's liquidation price beyond the stop, costs within one fifth of the planned loss, the group cap, the total cap. A failed ceiling, group or total check means size down or pass. A failed liquidation check means a lower leverage setting or a pass. A failed cost check means a pass or a shorter planned hold, because a smaller size shrinks costs and the planned loss together.
Objectives
This step supports one decision: how large a position a plan may carry, or whether it gets none. It comes here because size has to be fixed before the order form opens. It uses the Risk ceiling line from your charter and the fee, funding and liquidation lines from your fact sheet.
- Calculate a position size from a stop distance, a planned loss and your contract's costs.
- Check that size against the ceiling, the liquidation price and the cost limit, in order.
- Group open positions and add their planned losses, by group and in total.
- Define a pause trigger in R that you can apply the moment it fires.
The 1 to 2% planned loss and the 3x ceiling are house constraints, and the group cap reuses the per-trade limit. The grouping line, the 4% total, the pause rule and the cost limit are this manual's choices. None is a recommended allocation, and a percentage cannot tell you whether the stop is right. Less, or no position, is always allowed. Two fields are yours alone: the pause trigger, and the daily limit, for which this manual names no figure, so "none" is a legitimate entry.
Hypothetical walkthrough: a trade that fits and a trade the group turns down
Hypothetical walkthrough. Invented prices and an invented outcome, chosen to teach the decision. Not a recorded trade, and not evidence of how often this setup works.
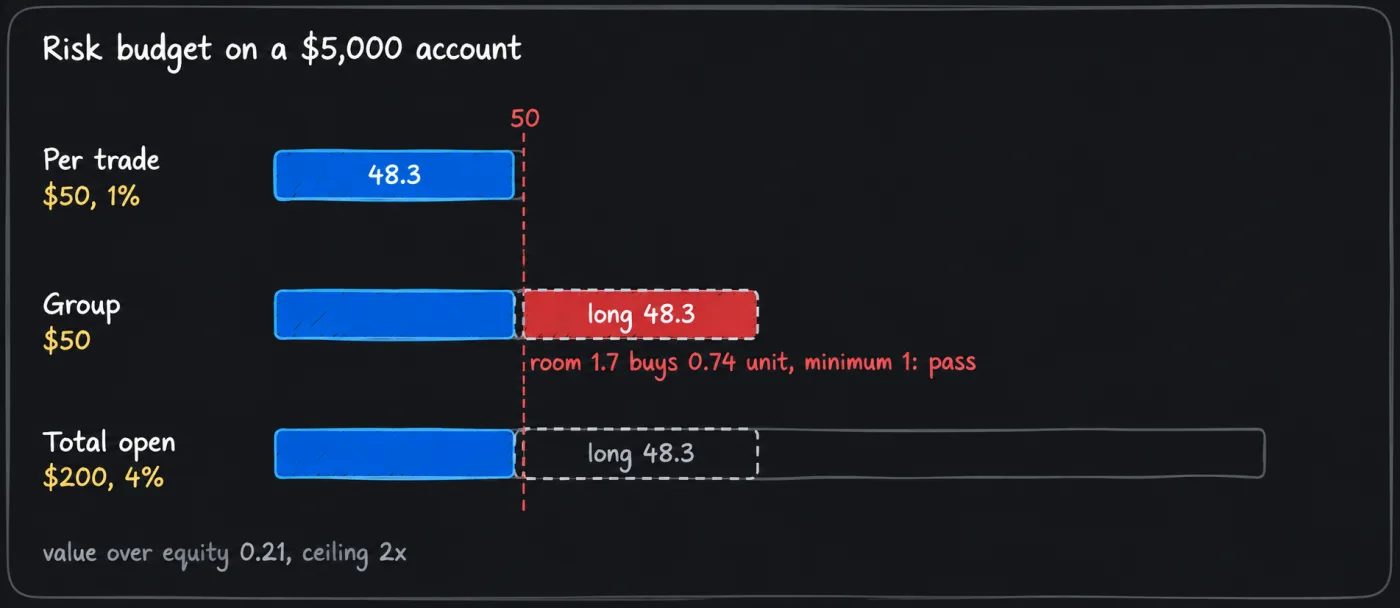
Assume the reader from chapters 1 and 2, with a $5,000 account, a planned loss of 1% ($50), a 2x ceiling and a total cap of $200. Their group cap equals their per-trade limit, $50. They have measured no correlations, so all positions in the same direction count as one group, and the contract page gives a minimum order of 1 unit.
Trade one is a long at 50 on the other coin on their Markets line, a linear contract, with the stop order at 48, a distance of 2. Its own fact sheet reads a 0.06% taker fee and funding of 0.01% per 8 hours. Assume a cost per unit of 0.30 on a reference price of 50: fees 0.06 (both fills), funding 0.03 (six payments over a two-day hold) and 0.21 for spread and slippage from recent fills. Units = 50 / (2 + 0.30) = 21.7, rounded down to 21. Position value is 1,050 and the planned loss, costs included, is 21 x 2.3 = 48.3. The checks, in order:
- The setting is 2 and value over equity is 0.21, both within the ceiling.
- The ticket estimates liquidation at 25.1, which is 22.9 below the stop, and the stop sits 2 from entry. This manual names no distance for "well beyond", so the gap is written down and judged against the stop.
- Costs of 6.3 are 13% of 48.3, under one fifth.
- The group holds 48.3 of its 50, and the account 48.3 of 200.
They place it. Next day a long in the first coin is sized the same way. Assume it also comes to 2.3 per unit of stop distance and costs, a planned loss of 48.3 and a 1-unit minimum. Its own checks pass, but both longs are one group, and the group has 1.7 of room. That buys 1.7 / 2.3 = 0.74 of a unit, below the minimum. The reader logs "pass: group room below minimum order", and the stop stays where the chart put it.
The outcome was chosen to show a cap catching a trade whose own sums were fine.
Reading list
- Where to place a stop loss: the stop goes beyond the level that proves the idea wrong, before any size exists.
- Position sizing: the sum, the cost allowance, the 3x check, and why a wide stop means a small position.
- Portfolio risk: grouping correlated positions, the cap per group and the 4% total.
- Expectancy and drawdown: what a run of stop-outs does to a balance, and the pause trigger in R.
- Risk limits: every limit as a tick-box list to hold your sheet against.
The first two size one trade, the third adds trades together, the fourth shows a bad run, and the fifth is the checklist. Fill the sheet while no idea is live: a limit written to fit one can end up set by the idea.
This chapter cannot settle where the stop goes. The sheet leaves the stop distance blank because no form can fill it: it comes off a chart, at the price where the idea is wrong. Charting tools sets up the charts and watchlist you will mark it on, and placing a stop well comes in later chapters.
You should now be able to
- Calculate a position size from a stop distance, a planned loss and the costs on your fact sheet.
- Check that size against the ceiling, the ticket's liquidation price and the one-fifth cost limit, in order.
- Say whether a new position fits under the group cap and the total cap, or is a pass.
- Work out how many full stop-outs in a row fire your pause trigger.
- Produce: your risk budget sheet (planned loss, ceiling, group rule, open-loss cap, pause trigger, your own daily limit, sizing formula), using the table at the top of this page.